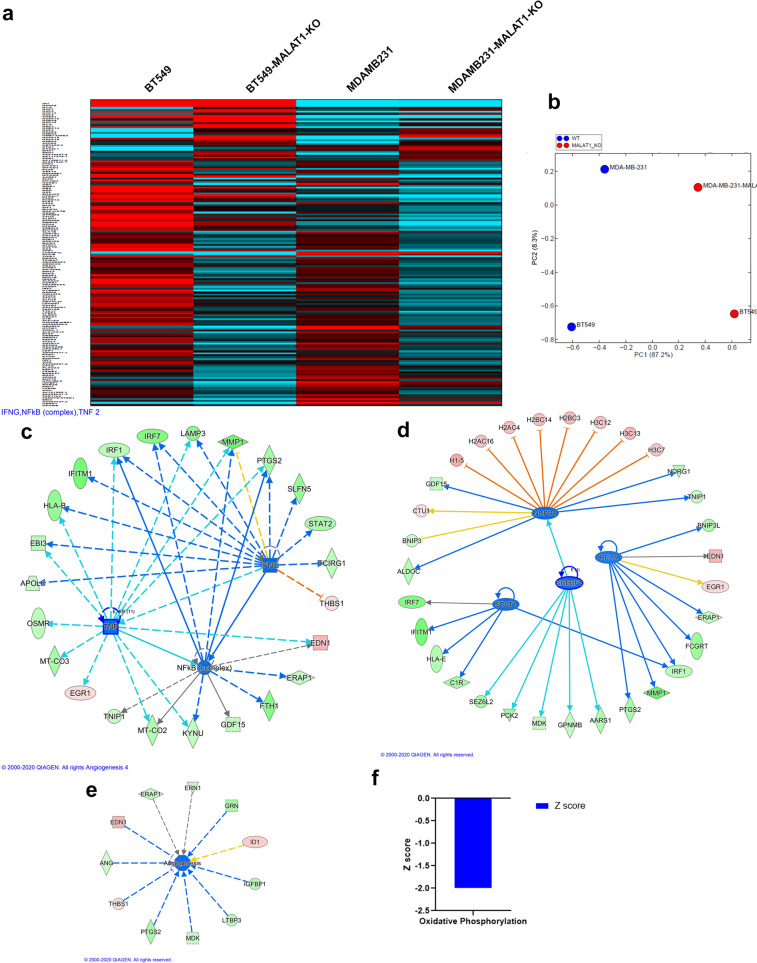
Fig. 5. Alteration of gene expression in MALAT1-KO TNBC cells.
a Heatmap depicting the expression of upregulated (32) and downregulated (129) genes (1.5 ≤ fc ≥ 1.5) in the BT-549 and MDA-MB-231 TNBC models using whole transcriptome analysis. b Principal component analysis (PCA) illustrating the segregation of BT-549, BT-549-MALAT1-KO, MDA-MB-231, and MDA-MB-231-MALAT1-KO based on PC1 and PC2. Ingenuity pathway analysis (IPA) on the 161 common differentially expressed transcripts in MALAT1-KO TNBC models highlighting suppression of INFG, NFKB, and TNF networks (c). Suppression of NUPR1, STAT1, RELA, and SREBF1 transcription regulator (d), angiogenesis functional category (e), as well as oxidative phosphorylation canonical pathway (f) in MALAT1-KO TNBC cells.

