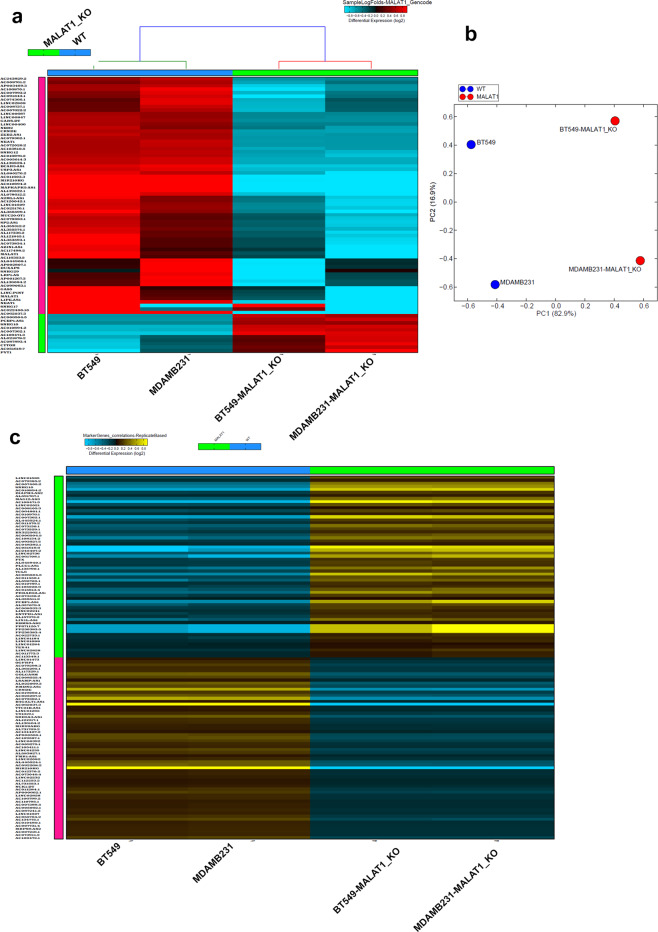
Fig. 6. LncRNA transcriptome alterations in MALAT1-KO TNBC models.
BT-549-MALAT1-KO, MDA-MB-231-MALAT1-KO, and corresponding parental lines were subjected to whole transcriptome and gencode v33 lncRNA analysis. a Hierarchical clustering of BT-549-MALAT1-KO, MDA-MB-231-MALAT1-KO and corresponding parental TNBC models based on lncRNA transcriptome. Each column represents one cell and each row represents lncRNA transcript. The expression level of each transcript (log2) in each sample is depicted according to the color scale. b Principal component analysis (PCA) illustrating the segregation of BT-549, BT-549-MALAT1-KO, MDA-MB-231, and MDA-MB-231-MALAT1-KO based on PC1 and PC2. c Heatmap depicting the most significant lncRNAs associated with the MALAT-KO vs parental phenotype. Expression is depicted according to the color scale.

