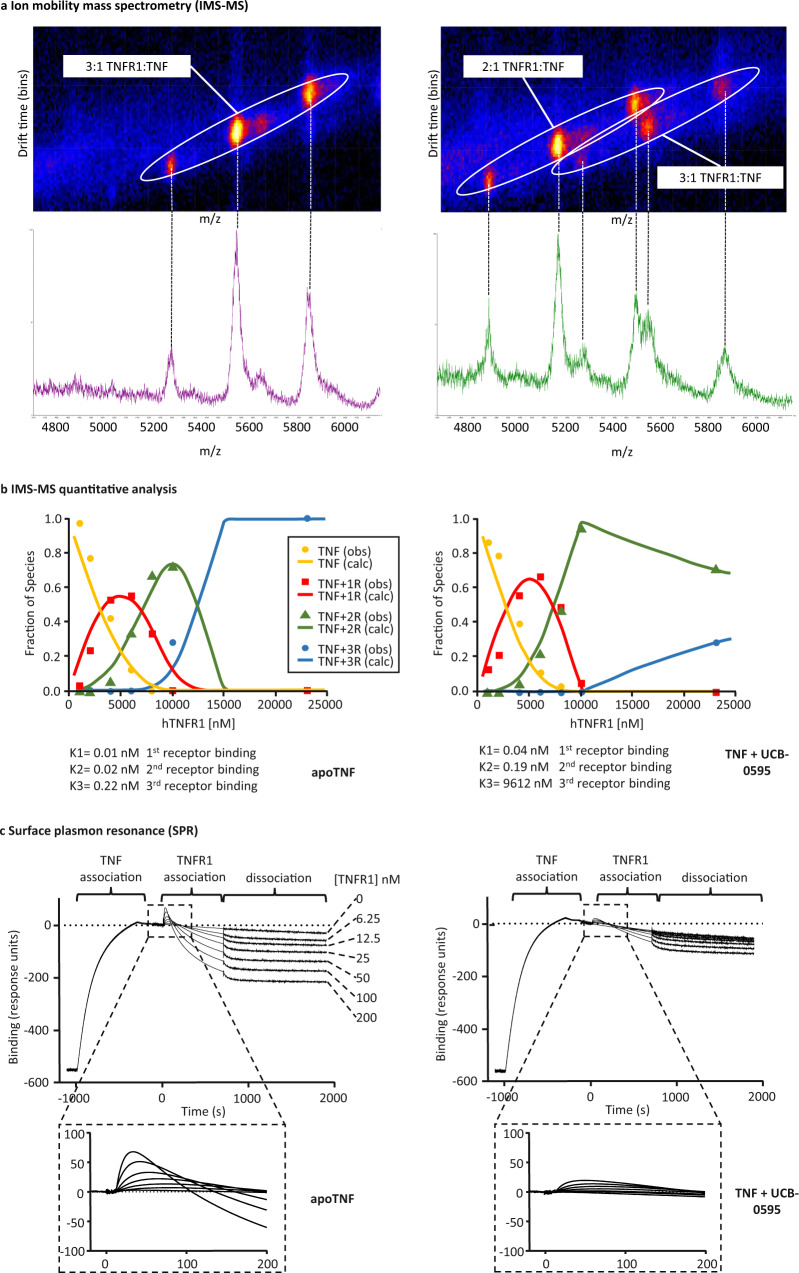
Fig. 1. Effect of compounds on TNF–TNFR1 interaction.
a IMS-MS of hTNF with 5-fold excess hTNFR1 (left panel), hTNF plus UCB-0595 (10-fold excess) and 5-fold excess hTNFR1 (right panel). Circled signals and corresponding peaks show three ionisation states for each receptor-bound form. b Quantitative analysis of IMS-MS data generated using hTNF and hTNF plus UCB-0595 (10-fold excess) (left and right panels, respectively) over a range of hTNFR1 concentrations (x axis). Traces (calc—calculated) indicating the percentage of each species; 0 receptor, 1 receptor, 2 receptor and 3 receptor-bound are shown (yellow, red, green and blue traces, respectively). Symbols (obs—observed) represent experimentally measured molar fractions of the different species in equilibrium (n = 1 independent experiments, a similar reduction in affinity of the third receptor binding was observed for multiple compounds—Supplementary Table 1). Source data are provided as a Source Data file. c SPR of hTNF (left panel) and hTNF plus UCB-0595 (10-fold excess) (right panel) binding to immobilised hTNFR1 (first injection) followed by injection of hTNFR1 at a range of concentrations. Detail of the TNFR1 binding response (third receptor binding) is highlighted (dashed box) (n = 1 independent experiments).

