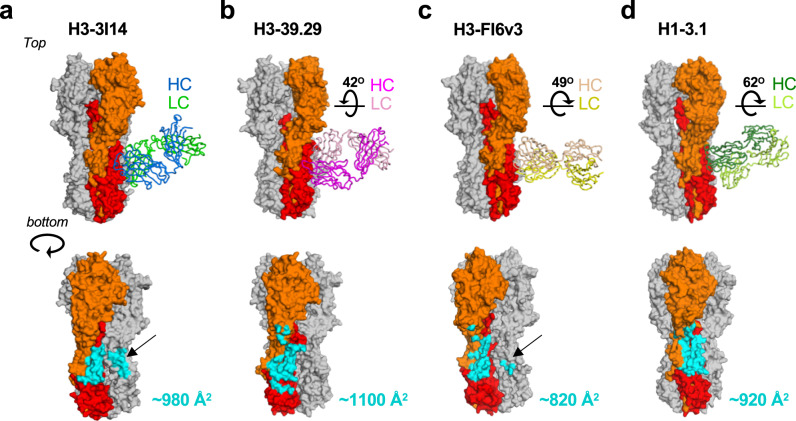
Fig. 5. Angles of approach towards HA for VH3-30 BnAbs.
a–d Top: angles of approach for each of the VH3-30 antibodies (H3-39.29, PDB 4KVN; H3-FI6v3, PDB 3ZTJ; H1-3.1, PDB 4PY8). HA is shown in surface representation with HA1 and HA2 from the primary protomer colored orange and red, respectively. Each Fab is shown in cartoon representation with 3I14 colored as in Fig. 4, and 39.29, FI6v3, and 3.1 colored according to the labels. The degrees shown in figures b–d is the rotation necessary to superimpose the VH domain of that antibody onto the VH domain of 3I14, as determined in Coot. Bottom: HA portion for each complex from the top panel, rotated ~45o. The buried surface area for each antibody is colored cyan on HA. The black arrows in a and c indicate cross-protomer interactions.

