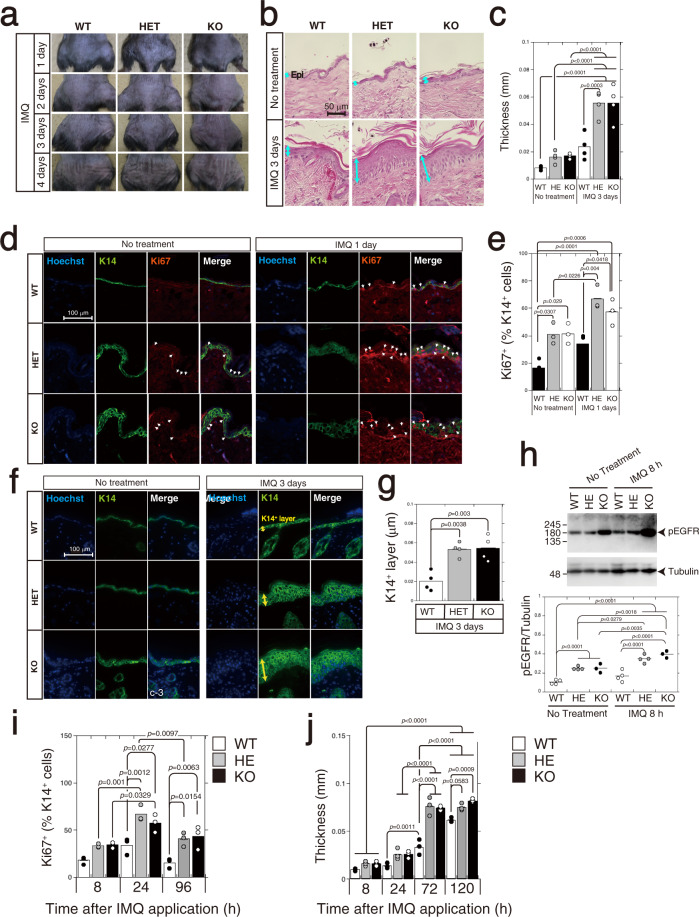
Fig. 8. CS-C regulates keratinocyte proliferation and skin thickness in imiquimod-induced inflammation model of psoriasis.
a Macroscopic phenotypical representation of psoriatic lesions in C6st-1 WT, C6st-1 HE, and C6st-1 KO mice, treated daily with imiquimod. Images acquired at 1, 2, 3, and 4 days after initial treatment. b Back skin sections from C6st-1 WT, C6st-1 HE, and C6st-1 KO, mice treated or untreated with imiquimod on day 3 after initial treatment, stained using H&E. Yellow arrows indicate epidermis. c Graph shows epidermal thickness. Values are mean ± S.D. from four specimens. Statistical significance was determined using one-way ANOVA with Tukey’s HSD test. d Dorsal skin sections from C6st-1 WT, C6st-1 HE, and C6st-1 KO mice, treated or untreated with imiquimod for 1 day, were labeled with anti-K14 and anti-Ki67 antibodies. Nuclei were counter-stained with Hoechst33342. Arrows indicate Ki67-positive cells within K14-positive basal layer. e Ki67-positive cells in the K14-positive layer were quantified. Bars represent means ± S.D. from three specimens. Statistical significance was determined using one-way ANOVA with Tukey’s HSD test. f Dorsal skin sections from C6st-1 WT, C6st-1 HE, and C6st-1 KO mice treated or untreated with imiquimod on 3 day after initial treatment, were stained with anti-K14 antibody. Nuclei were counter-stained with Hoechst33342. Yellow arrows show K14-positive basal layer. g Thickness of the K14-positive basal layer was measured. Bars represent means ± S.D. from four specimens. Statistical significance was determined using one-way ANOVA with Tukey’s HSD test. h Epidermis from C6st-1 WT, C6st-1 HE, and C6st-1 KO mice, treated or untreated with imiquimod for 8 h, analyzed via immunoblotting using anti-phospho-EGFR and anti-tubulin. Graph under blots shows relative expression of phospho-EGFR in C6st-1 WT, C6st-1 HE, and C6st-1 KO epidermis. Values represent the mean ± S.D. with n = 3 or 4 per group. Statistical significance was determined using one-way ANOVA with Tukey’s HSD test. i Ki67-positive cells in epidermis at 8, 24, and 96 h after application of imiquimod, quantified as percentage of K14-positive cells. j Epidermal thickness was measured at 8, 24, and 96 h after imiquimod application. Values are mean ± S.D. with n = 3 per group. Statistical significance was determined using one-way ANOVA with Tukey’s HSD test.

