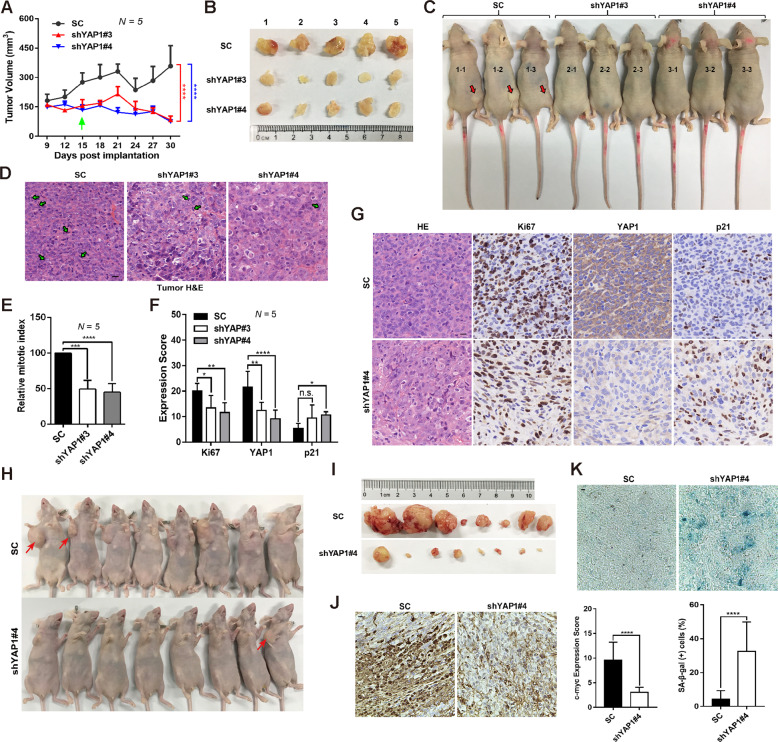
Fig. 3. YAP1 coordinates with p21 to control the growth of xenograft tumors.
A–C YAP depletion inhibits xenograft tumor growth. control shRNA or YAP1-depleted SW 1353 cells were subcutaneously inoculated in the flanks of nude mice. Nine days after injection, tumor growth curves were constructed based on the tumor volumes measured every 3 days (A); statistical significance was found 15 days post implantation. Ex vivo images of xenograft tumors at 30 days after dissection (B); in vivo images of representative nude mice (C). D, E YAP depletion suppresses xenograft tumor cell mitosis. Tumor sections were stained with H & E, arrows indicate mitotic cells (D), and the relative mitotic index was quantified (E), scale bars: 10 μm. F, G YAP negatively regulates p21 expression in vivo. Tumor sections of (B) were stained with H&E or IHC for Ki67, YAP1, and p21 (G); the IHC scores for Ki67, YAP1, and p21 in the mouse tumor sections were measured (F), scale bars: 10 μm. H, I SC and shYAP1#4 stable SW 1353 cells were subcutaneously inoculating into the nude mice at the right flank next to the forelimb for 57 days, the representative in vivo images of nude mice (H) and ex vivo xenograft tumors (I) were shown. J Tumor sections of (I) were stained with c-myc (left) and the IHC scores were measured (right). K Frozen sections of the fresh tumors were stained with SA-β-gal (above) and the percentage of SA-β-gal-positive cells were determined (below). Data are presented as the mean ± SD of at least three independent experiments in (A, E, F, K). One-way ANOVA followed by Dunnett’s test was applied for (E, F). Two-way ANOVA followed by Tukey’s test for (A). Student’s t-test for (K). n.s.: Nonsignificant, *P < 0.05, **P < 0.01, ***P < 0.001, ****P < 0.0001.

