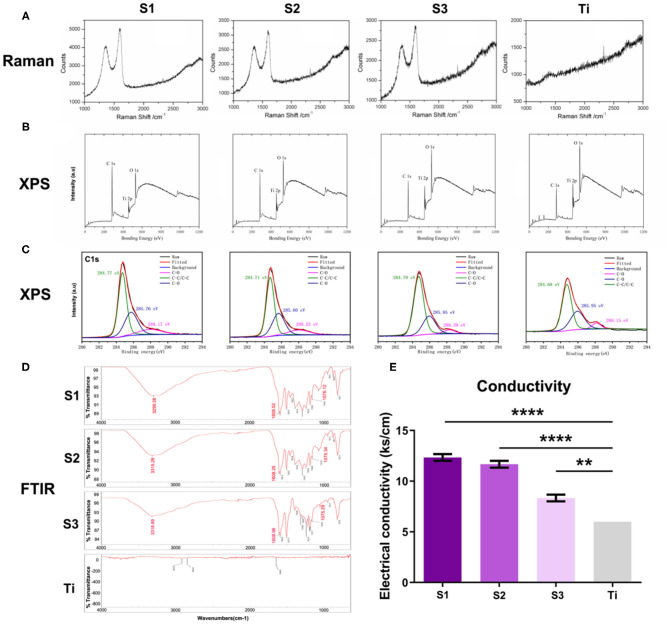
Figure 2.
The characterization of the graphene-coated titanium sheets. (A) The Raman spectra, (B) XPS measurement spectra, (C) the high resolution XPS C1s core level spectra, (D) FTIR spectra and (E) the conductivity of graphene-coated titanium sheets (S1, S2, and S3) and titanium sheet (Ti). (**p < 0.01 and ****p < 0.0001).

