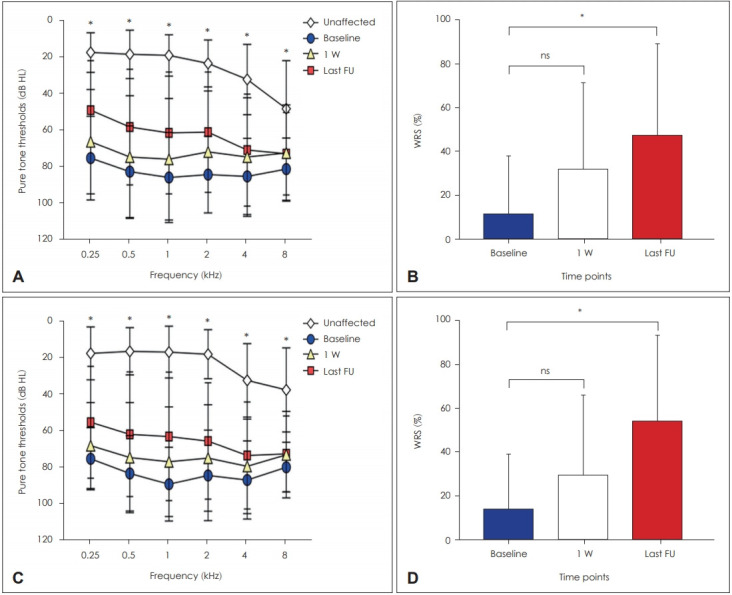
Fig. 1.

Hearing outcome in combination and non-combination groups. Fig. 1 shows the results of PTA and WRS in combination group (A and B) and non-combination group (C and D). Pure tone thresholds and WRSs were presented at three different time points (baseline, one week after treatment, and last follow-up). *post hoc analysis between baseline and last follow-up. PTA: pure-tone average, WRS: word recognition score.
