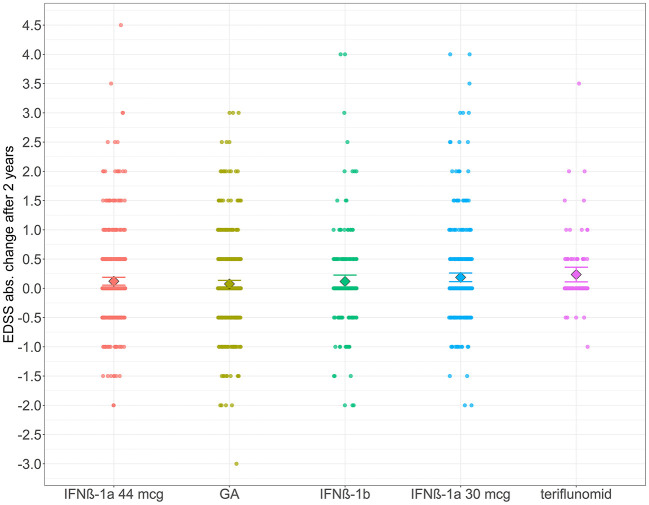
Figure 2.
The distribution of absolute change in the EDSS scores 2 years from baseline and the 95% confidence interval estimates of means for the DMD groups. Data points (circles) show all values of 2-year absolute change in EDSS. The rhombus represents the group mean, and error bars depict 95% confidence interval estimates of means for the DMD groups.

