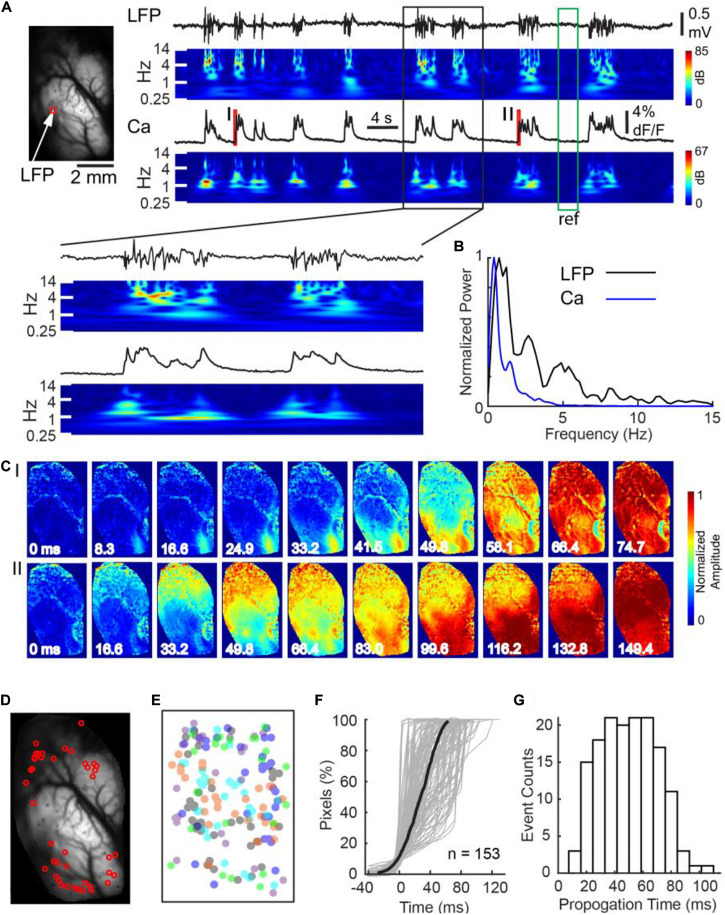
FIGURE 1.
Calcium imaging at burst onset at a single hemisphere. (A) Left panel: field of view. The white arrow and red box indicate where the LFP and calcium fluorescence, displayed on the right, were recorded, respectively. Right panel: LFP and calcium fluorescence traces and their corresponding spectrograms. The spectrograms were normalized to the reference period marked by the green box. Calcium dynamics during the onsets of the two bursts, marked with red bars I and II, are further displayed in Panel C. A black box indicates a section of data which was shown with expended time scale in below. (B) The power spectrum of Ca and LFP traces during bursts shown in A. (C) The spatiotemporal evolution of calcium signals during the two burst onsets. Each burst first emerged at a small focus and subsequently propagated contiguously throughout the whole field of view. Notice the two bursts had separate cortical onset sites. (D) The spatial distribution of cortical onset sites of the first wave of 42 bursts recorded in one animal. (E) The spatial distribution of cortical onset sites of 153 first waves in five animals. Each color represents one animal. The center of each animal’s imaging window is superimposed on each other. Cortical onset sites did not distribute into any single dominant region. (F) Rapid propagation of burst activity over a hemisphere. Percentage of pixels that crossed their burst thresholds was plotted against time. Each gray line represents the recruitment process of an individual burst. The thick black line represents the average recruitment process of 153 bursts in 5 animals. (G) The distribution of burst propagation time.

