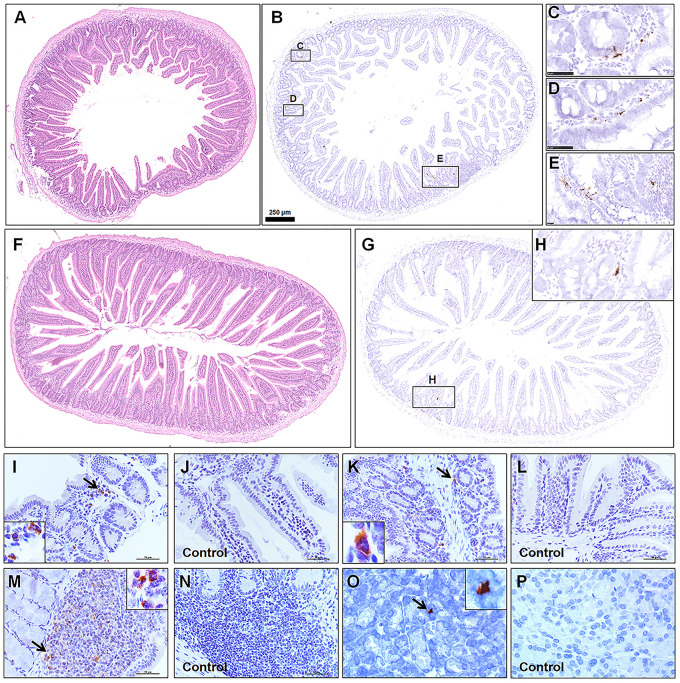
FIGURE 4.
Observation and examination of the alimentary system at 5 dpi. (A–E) Observation of the duodenum by H&E and examination by ISH. (F–H) Observation of the jejunum by H&E and examination by ISH. (I–P) The ileum, colon, Peyer’s lymph nodes, and pancreas tissues from the infected group and mock control group were examined by IHC. The black frames in the corners are a magnification of the arrowed region in the respective panel. Sequential sections were stained by H&E and subjected to ISH and IHC. Data are representative of three independent experiments.

