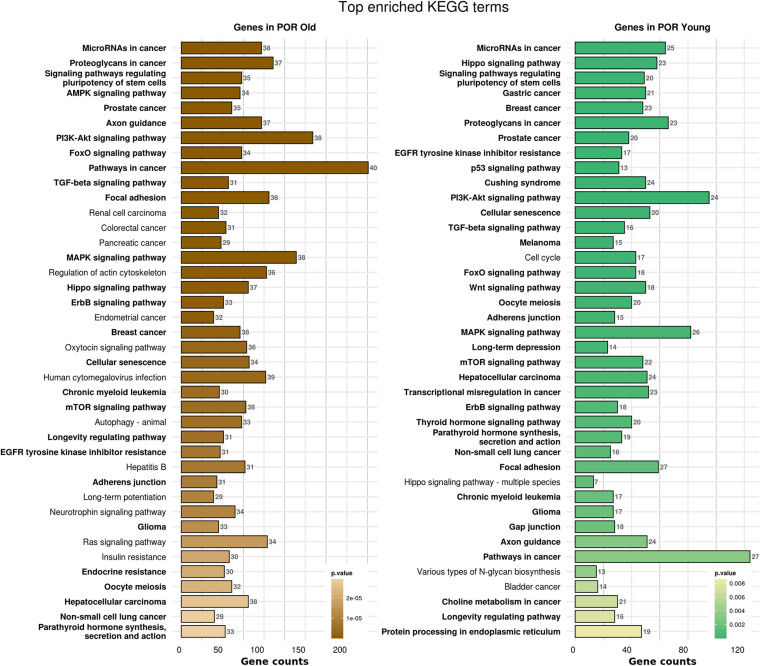
FIGURE 2.
Functional significance of miRNA targets in POR old and POR young categories. The top significantly enriched KEGG pathways, containing targeted genes for the upregulated and downregulated set of miRNAs in each category, are portrayed. The X-axis depicts the number of miRNA targeted genes enriching each term. Pathways are ranked according to the enrichment p-value (p-Value < 0.01, Fisher’s exact test). The number of miRNAs implicated in each pathway is shown at the end of each bar. Intensity legend shows the p-value of each term. Common enriched pathways between the two categories are marked as bold.

