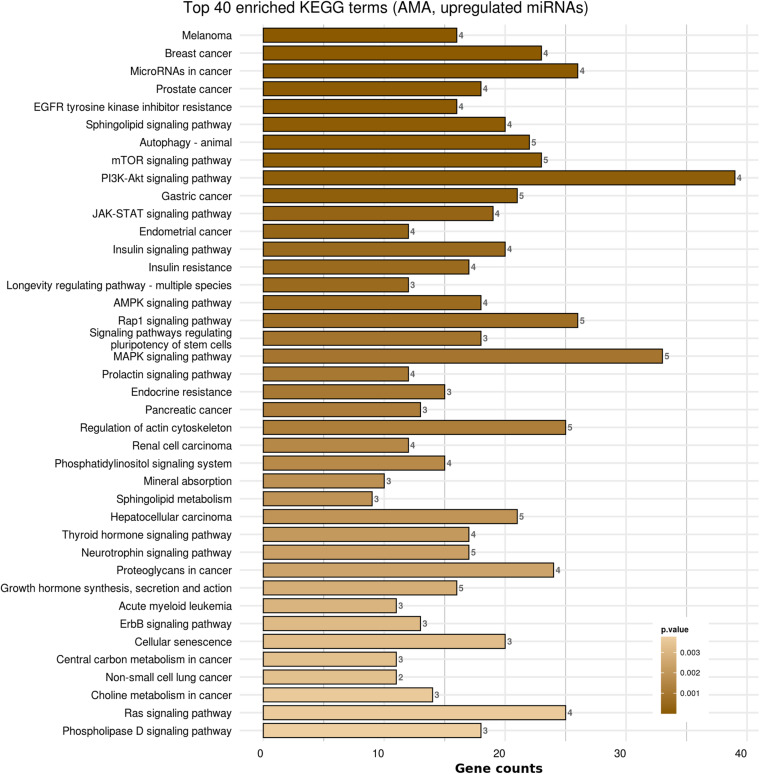
FIGURE 4.
Functional significance of miRNA targets in AMA category. The top significantly enriched KEGG pathways, containing targeted genes for the upregulated set of miRNAs, are portrayed. The X-axis depicts the number of miRNA-targeted genes enriching each term. Pathways are ranked according to the enrichment p-Value (p-Value < 0.01, Fisher’s exact test). The number of miRNAs implicated in each pathway is shown at the end of each bar. Intensity legend shows the p-Value of each term.

