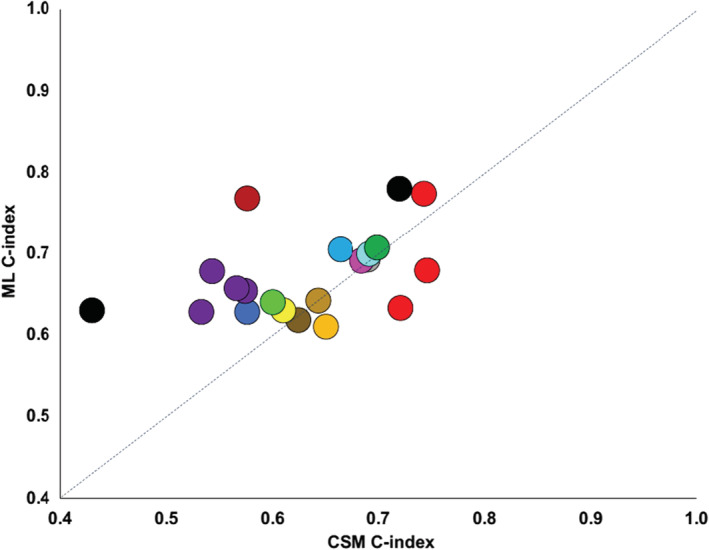
Figure 2.

Scatterplot of the highest reported c‐index for machine learning and conventional statistical approaches for readmission studies. Circles of the same colour indicate different time points in the same study publication. CSM, conventional statistical model; ML, machine learning.
