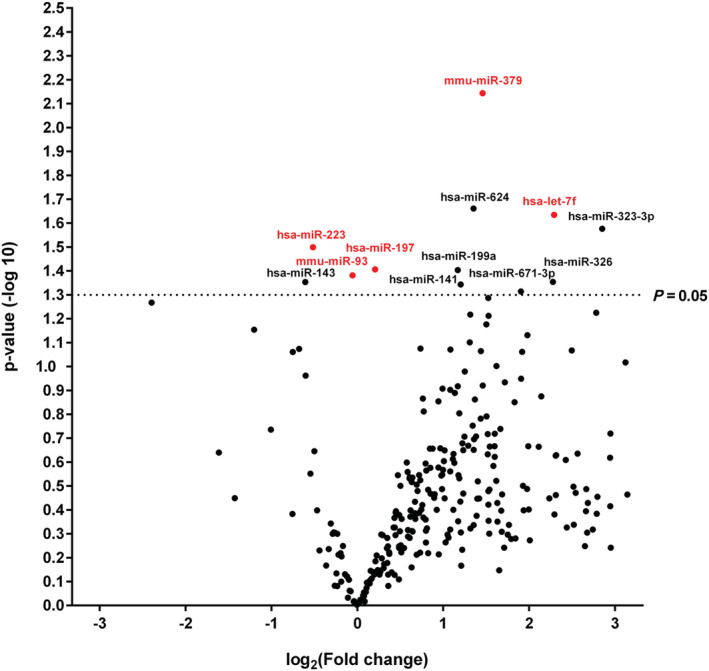
FIGURE 2.

Volcano plot: patients with inflammatory and/or virally induced myocardial disease (including dilated cardiomyopathy) vs. healthy donors. Comparisons of expression of 323 microRNAs (miRNAs) assessed in OpenArray analysis isolated from serum of patients with inflammatory and/or virally induced myocardial diseases (n = 184) or dilated cardiomyopathy (n = 25) and healthy controls (n = 25). The volcano plot displays the relationship between fold change and significance between the two groups, applying a Student's t‐test. The y‐axis depicts the negative log 10 of P‐values of the t‐tests (the horizontal slider at 1.3 corresponds to a P‐value of 0.05; a higher value indicates greater significance), and the x‐axis is the difference in expression between the two experimental groups as log2 fold. Highlighted are five abundant miRNAs (let‐7f, miR‐197, miR‐223, miR‐379, and miR‐93) significantly expressed in all study groups (Tables 3 and 5 ).
