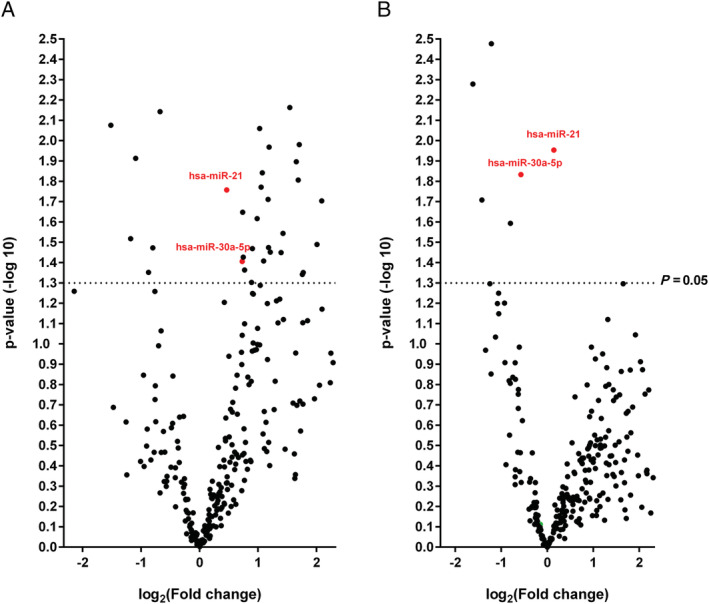
FIGURE 3.

Volcano plot: patients with dilated cardiomyopathy (DCM) vs. healthy donors (A) and vs. patients with inflammatory and/or virally induced myocardial disease (B). Comparison of 323 microRNAs (miRNAs) assessed in OpenArray analysis isolated from serum of DCM patients (n = 25), patients with inflammatory and/or virally induced (n = 184) myocardial disease, and controls (n = 25). Highlighted in green are two abundant miRNAs (miR‐21 and miR‐30a‐5p) significantly expressed in DCM group (Tables 3 and 6 ).
