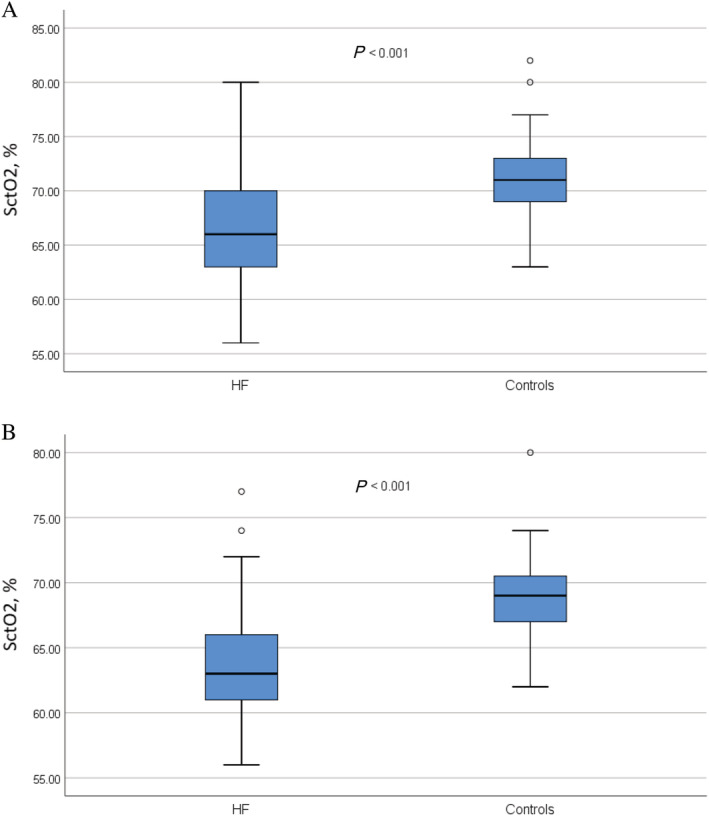
Figure 1.

Cerebral tissue oxygen saturation (Y‐axis) shown as percentage points in HF patients and controls. Cerebral tissue oxygen saturation in HF patients and controls (A) in the supine position and (B) after 10 min of head‐up tilt test. P values denote the difference between mean values, using independent samples t‐test. HF, heart failure; HR, heart rate; HUT, head‐up tilt; SctO2, cerebral tissue oxygen saturation; SBP, systolic blood pressure.
