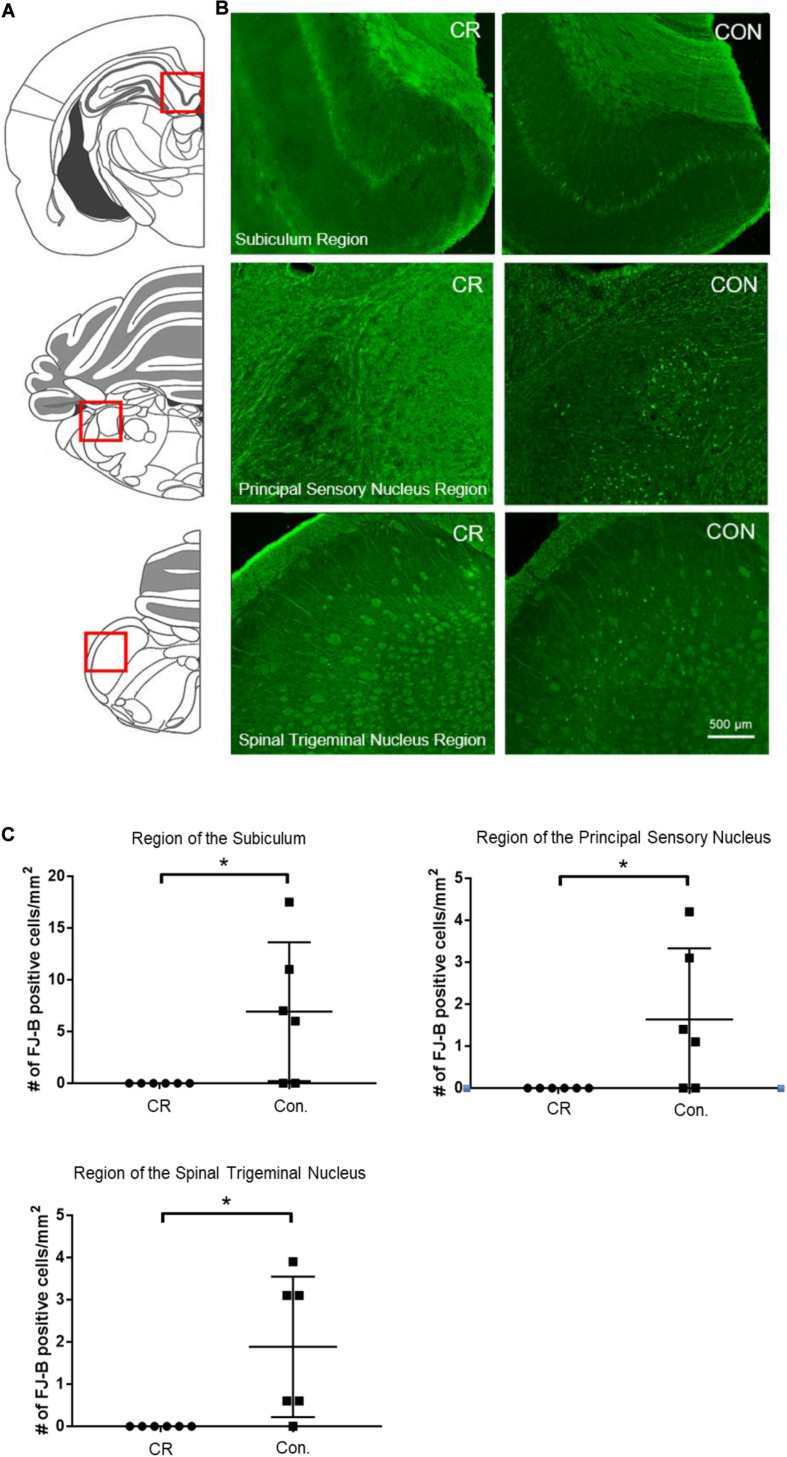
FIGURE 6.
Neurodegeneration in multiple brain regions at 72 h post-CA. (A) Brain atlas. The region within the red square displays the physiological locales of neurodegeneration as shown in (B). (B) Brain sections were stained with FJ-B; positive neurons are fluorescent (green). Images were cropped and signal intensities were adjusted linearly to be optimal for demonstration. (C) Number of FJ-B positive neurons were counted from 3 brain sections per region in each animal. The number of FJ-B positive neurons were significantly higher in control rats; CR rats exhibited no FJ-B positive neurons at these regions. Subiculum region t = 2.569; principal sensory nucleus region t = 2.376; spinal trigeminal nucleus region t = 2.875; df = 5, *p < 0.05 by unpaired t-test with Welch’s correction. CA, cardiac arrest; FJ-B, Fluorojade-B, CON, control; SEM, standard error of the mean.

