FIGURE 3.

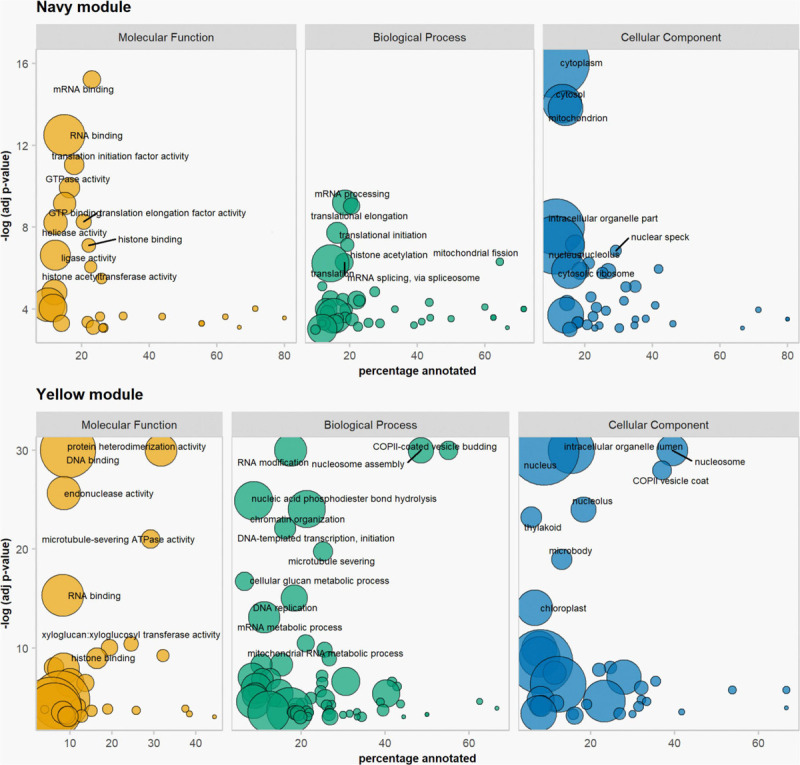
Gene ontology enrichment analysis. Results from the navy and the yellow modules of the WGCNA. Size of bubbles correspond to total number of proteins associated with the GO term.

Gene ontology enrichment analysis. Results from the navy and the yellow modules of the WGCNA. Size of bubbles correspond to total number of proteins associated with the GO term.