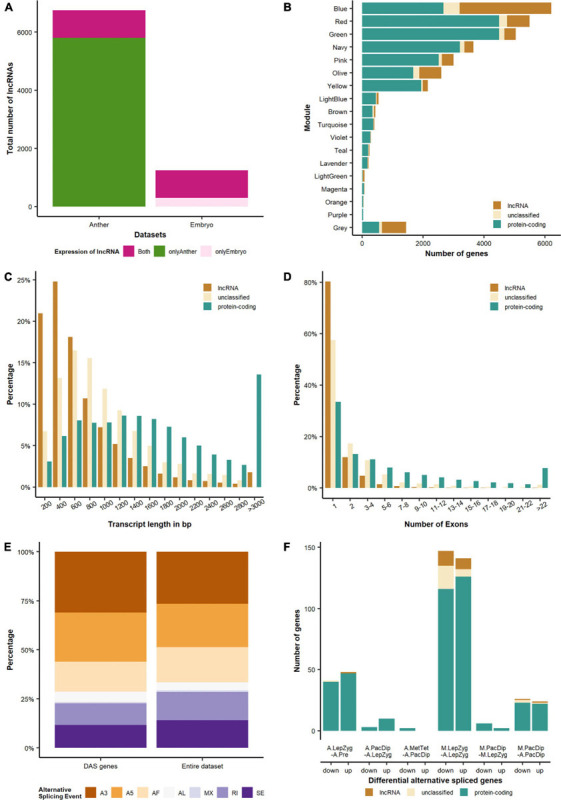
FIGURE 5.

Differential expression and alternative splicing of different gene categories. (A) Compared with germinating embryos, anthers are enriched in lncRNAs. (B) Distribution of coding, non-coding and undefined genes in different modules. The modules Violet, Turquoise, Navy, Green, Yellow and Olive are enriched in meiocytes. (C) Length and (D) exon number distributions of different transcript categories. (E) Distribution of alternative splicing events for the entire dataset and the DAS (differential alternative spliced) genes. A3, alternative 3′ splice-site; A5, alternative 5′ splice-site; AF, alternative first exon; AL, alternative last exon; MX, mutually exclusive exons; RI, retained intron; SE, skipping exon. (F) Differential alternative spliced genes. The comparisons are: A.LepZyg-A.Pre, anther leptotene–zygotene versus anther pre-meiosis; A.PacDip-A.LepZyg, anther pachytene–diplotene versus anther leptotene–zygotene; A.MetTet-A.PacDip, anther metaphase I–tetrad versus anther pachytene–diplotene; M.LepZyg-A.LepZyg, meiocyte leptotene–zygotene versus anther leptotene–zygotene; M.LepZyg-M.LepZyg, meiocyte leptotene–zygotene versus meiocyte leptotene–zygotene; M.PacDip-A.PacDip, meiocyte pachytene–diplotene versus anther pachytene–diplotene. The prefixes A. and M. in the sample names depict anther and meiocyte samples, respectively.
