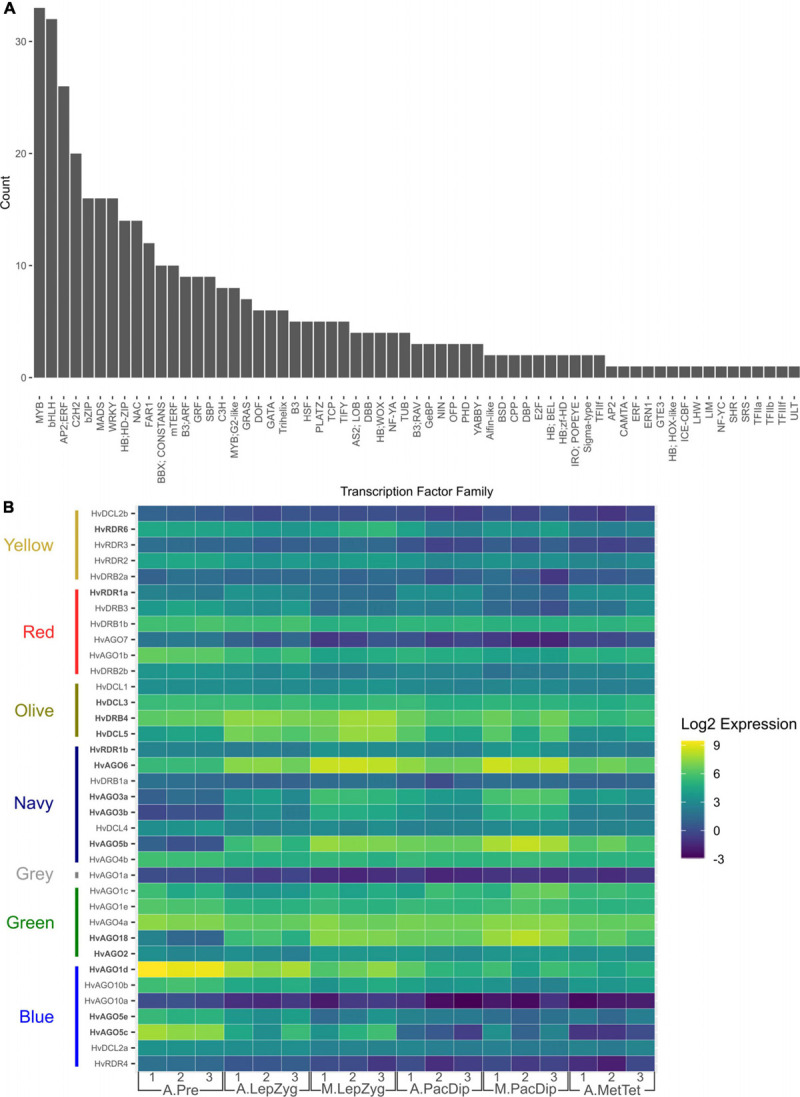
FIGURE 7.

Expression of transcription factor (TF) families in anthers and meiocytes. (A) Total number of TFs per family that are expressed in anthers and meiocytes. (B) Number of differentially expressed TFs determined by comparing their transcript levels in anthers at different stages. The comparisons are: A.LepZyg-A.Pre, anther leptotene–zygotene versus anther pre-meiosis; A.PacDip-A.LepZyg, anther pachytene–diplotene versus anther leptotene–zygotene; A.MetTet-A.PacDip, anther metaphase I–tetrad versus anther pachytene–diplotene. The prefixes A. and M. in the sample names depict anther and meiocyte samples, respectively.
