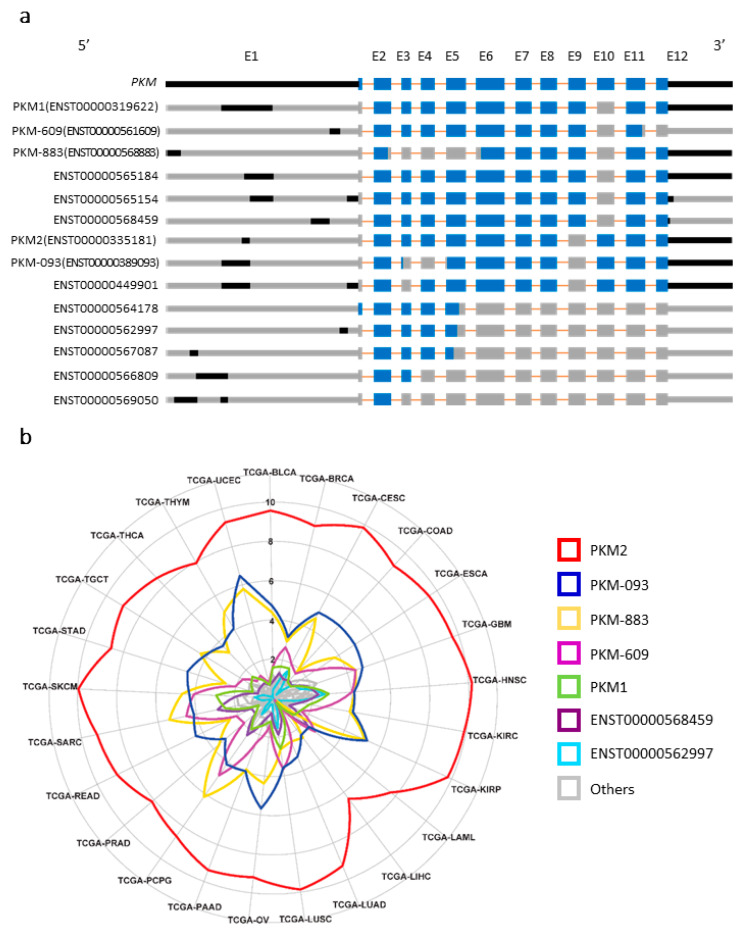
Figure 1.
Exon–intron structure of pyruvate kinase muscle type (PKM) transcripts and their corresponding expression levels in cancer and normal tissues. (a) Exon–intron structure of PKM transcripts. Blue color denotes translated region of exon. Orange color denotes intron. Black color denotes untranslated region of exon. Gray color denotes the missing sequence. (b) The expression levels of PKM transcripts in 25 human cancers from the Cancer Genome Atlas Program (TCGA). The transcripts per kilobase million (TPM) values were on log 2 scale.

