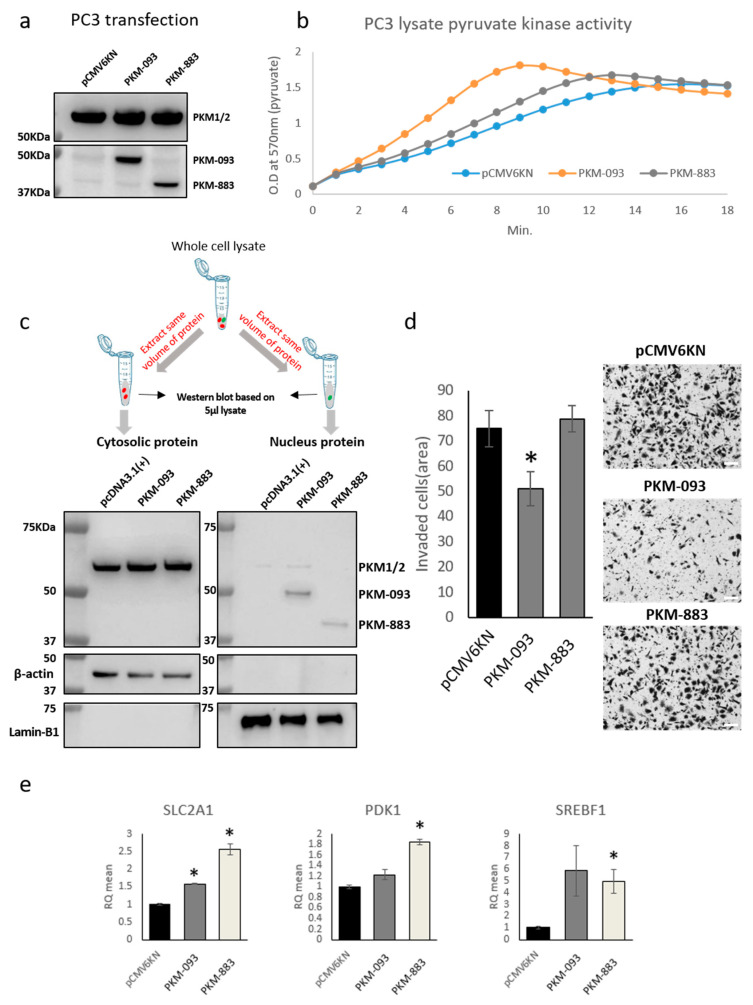
Figure 5.
Biological effect of PKM transcript over-expression in PC3 human prostate cancer cell line. (a) Western blots image showing the over-expression of transfected PKM-093 and PKM-883, respectively. (b) Pyruvate kinase activity kinetic assay. Kinetic PK activity was measured using 7.5 µg of each transfected cell lysate. PKM-093 and PKM-883 reached faster plateau status at 6 and 8 min, respectively, than pCMV6KN empty vector control which reached plateau at 10 min. (c) Western blots for the overexpressed proteins of PKM-093 and PKM-883 in cytosol and nucleus with the same protein volume (see Method Section 4.7). The red dot means cytosolic protein and the green dot means nuclear protein. (d) Bar chart and microscopy images showing the over-expression of PKM-093 and PKM-883 significantly inhibited cell invasion compared to negative control. Error bars indicate standard errors. * indicates t-test p < 0.05. Scale bar = 100 micrometer (µm). (e) Quantitative PCR analysis showing the mRNA level changes of SLC2A1, PDK1, and SREBF1 in PC3 cells with PKM-093 and PKM-883 over-expression compared to negative control. Error bars indicate standard errors. * indicates t-test p < 0.05.

