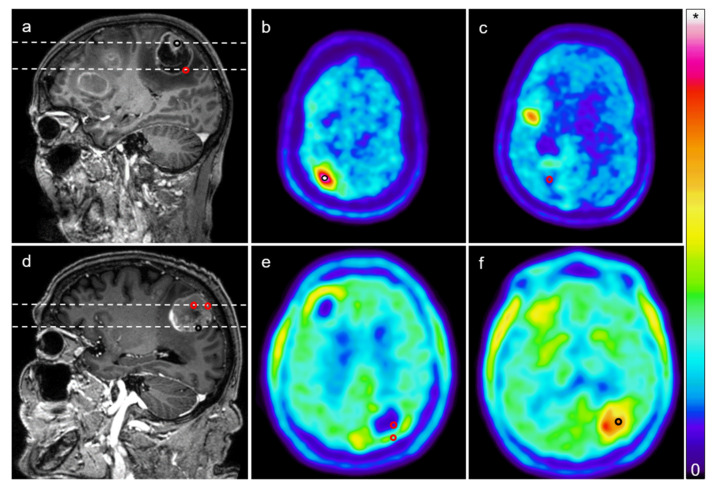
Figure 1.
Targeted biopsies from brain metastases. (a) Post-gadolinium magnetic resonance imaging (MRI) (T1) showing a contrast-enhancing mass lesion in the right central region of a patient with malignant melanoma; (b,c) [18F]FET positron emission tomography (PET) images corresponding to the imaging planes marked in a (upper dashed line: b; lower dashed line: c) showing elevated tracer uptake in a subvolume of the lesion and low tracer uptake in another part of the lesion. The black circle in a and b indicates the location of a biopsy from a “MRI-positive, PET-positive” part of the lesion that was marked during surgery using intraoperative navigation (mean tumor-to-background ratio (TBRmean): 4.27). The red circle in a and c indicates the location of a biopsy corresponding to a “MRI-positive, PET negative” part of the tumor (TBRmean: 0.79); (d) Another post-gadolinium MRI from a different case (left parietal lesion, adenocarcinoma of the stomach); (e,f) [18F]FET PET images corresponding to imaging planes marked in d (upper dashed line: e; lower dashed line: f). The black circle indicates the site of a biopsy from a “MRI-positive, PET-positive” part of the lesion, and the red circles indicate “MRI-positive, PET-negative” biopsy sites (TBRmean for anterior red circle: 0.27; posterior red circle: 1.04; black circle: 2.01). Note that MRI contrast enhancement does not necessarily correlate with high tracer uptake, illustrating both PET/MRI mismatch and intratumor heterogeneity. Colorbar illustrates PET standardized uptake values (* maximum in (b,c): 3.82; (e,f): 5.0).

