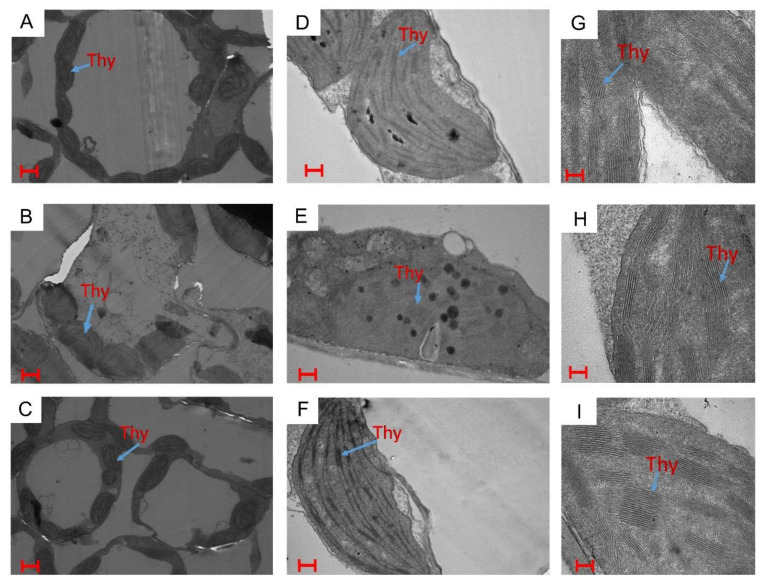
Figure 3.
Ultrastructure of chloroplasts in mustard leaves using transmission electron microscopy at a magnification of 1.2 kx (A–C), 6.0 kx (D–F) and 15.0 kx (G–I) under (A,D,G) control, (BEH) 100 mM NaCl, and (C,F,I) 200 mg S kg−1 soil + 200 µl L−1 ethephon with 100 mM NaCl at 30 d after sowing. Bars (A–C) = 500 nm; bars (D–F) = 100 nm; bars (G–I) = 20 nm. Thy = thylakoid membranes.

