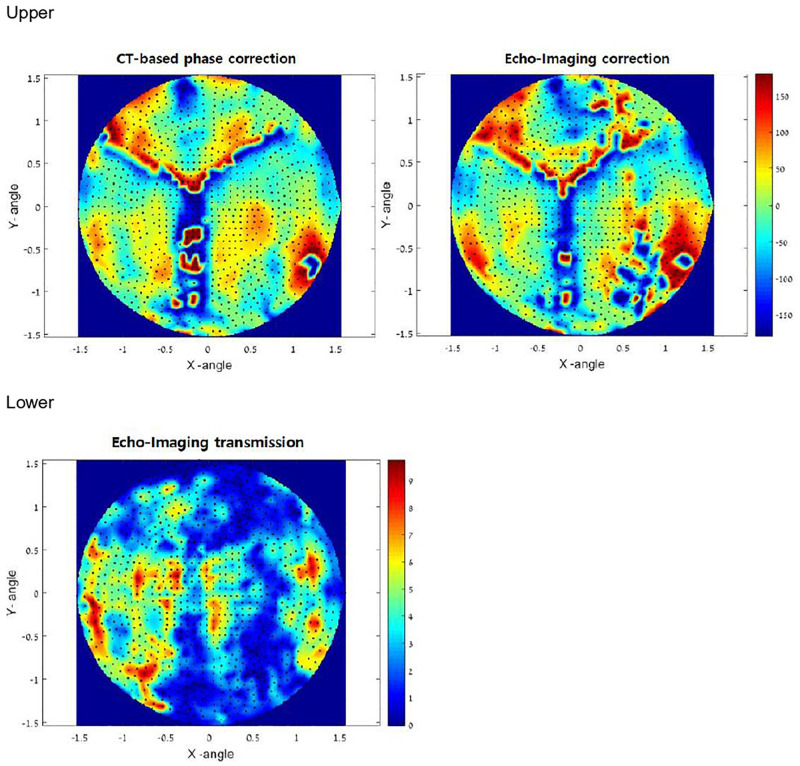
FIGURE 4.
Upper: In vivo phase correction compared in a clinical experiment. The left side shows computed tomography (CT)-based correction. The right side represents the echo imaging method. The image is projected onto the transducer surface. Echo imaging correction is calculated independently of the CT-based phases. Algorithm similarity score: AF/CT = 0.63. Lower: Transmission signal amplitudes (relative) measured in vivo using echo imaging. Image is projected onto the transducer surface.

