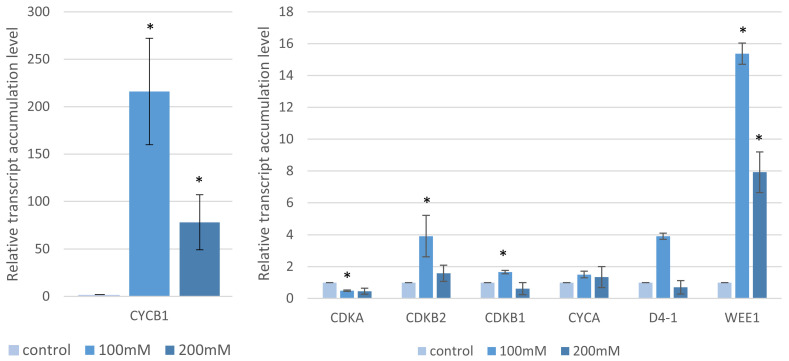
Figure 8.
Relative level of the accumulation of the cell cycle gene transcripts after “salt shock” treatment with various concentrations of NaCl. Relative expression levels were normalized to an internal control (Bradi1g32860; encoding ubiquitin) and calibrated to the control. Asterisks indicate significant differences from the control using the Student’s t-test (p < 0.05; mean ± SD, n = 3).

