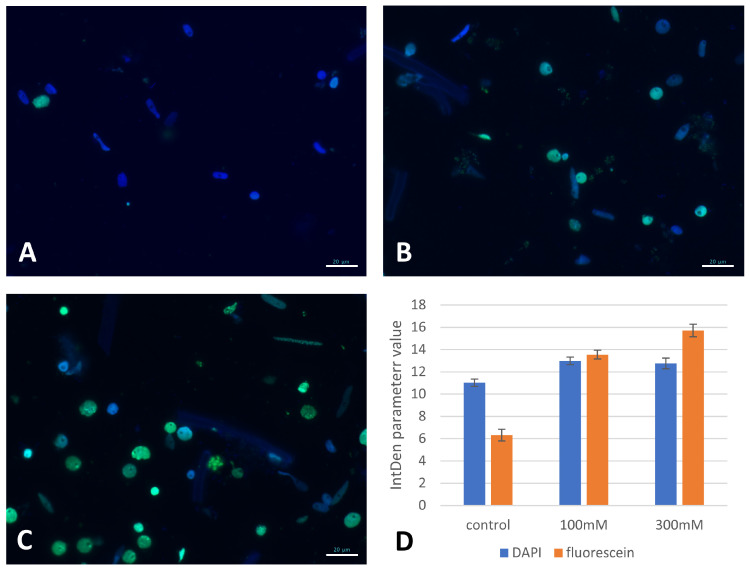
Figure 9.
TUNEL test in the root cells of the “salt-shocked” Brachypodium seedlings. (A) Control, (B) 100 mM NaCl, (C) 300 mM NaCl. DAPI stained nuclei with or without green fluorescence of built-in fluorescein as a result of the TUNEL reaction. Levels of relative fluorescence intensity (IntDen parameter) of DAPI and fluorescein (D); values are shown as the average values ± SE. Blue colour—DAPI fluorescence; green colour—fluorescein fluorescence. Scale bars represent 20 µm.

