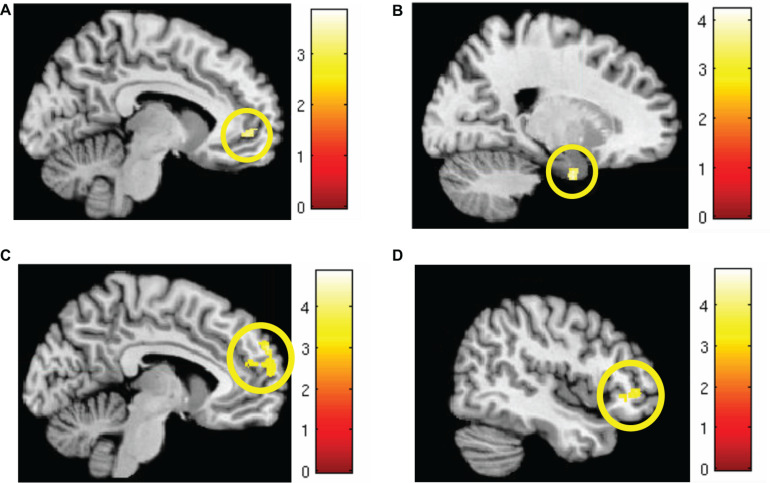
FIGURE 3.
Areas of significant regional activation during the first 6 trials of the extinction learning phase, CS+I > CS+U. (A) Left vmPFC; (B) right parahippocampus; (C) left dmPFC; and (D) bilateral vlPFC. MC corrected p ≤ 0.001. Heat maps for each region represent Z-scores, which are reported alongside p-values in Table 3.

