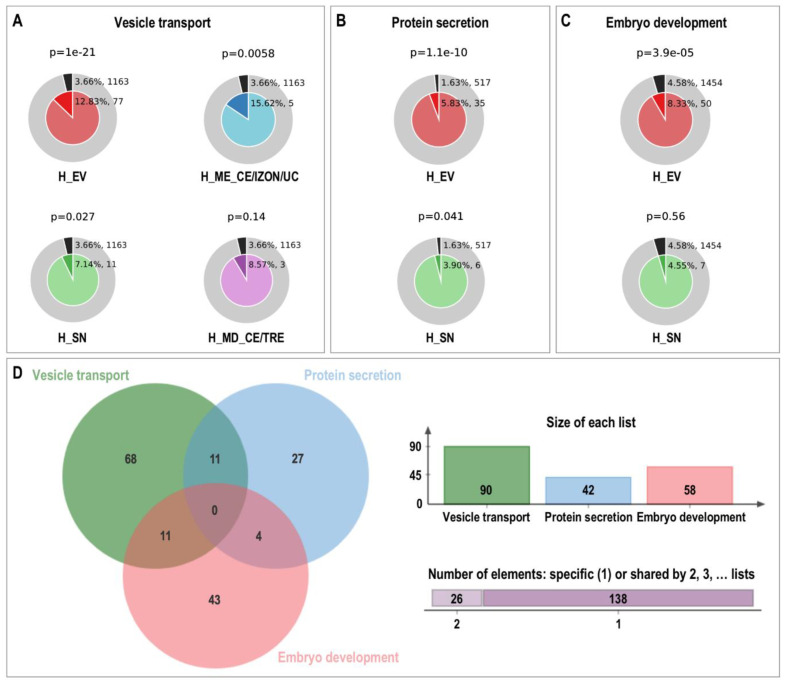
Figure 7.
Functional membership analysis for proteins identified by Mass Spectrometry for specific terms using Metascape tool. Enrichment of proteins matching membership terms: (A) “vesicle transport”, (B) “protein secretion” and (C) “embryo development”. The outer pie shows the number and the percentage of proteins in the background that are associated with the membership (in black); the inner pies shows the number and the percentage of proteins in the individual input gene list that are associated with the membership. The p-value on the top of the pie charts indicates whether the membership is statistically significantly enriched in the list. H_EV: proteins highly enriched in EVs obtained by all methods; H_SN: proteins highly enriched in supernatant (SN); H_MD_CE/TRE proteins highly abundant in MD_CE/TRE; H_ME_CE/IZON/UC: proteins highly abundant in ME_CE/IZON/UC. (D) The Venn diagram illustrates the total number of proteins found for each membership term using the Metascape tool and the number of protein common or exclusive for each term.

