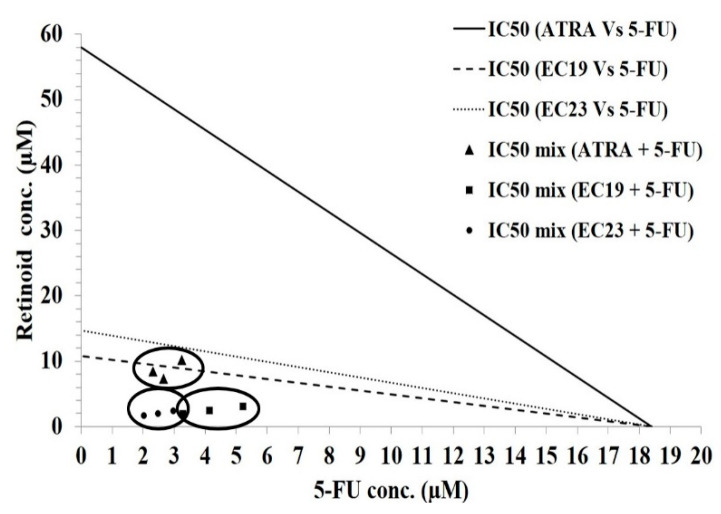
Figure 2.
Isobologram analysis applied to Caco-2 cells co-treated with 5-FU in addition to ATRA, EC19, or EC23 for 24 h. The antagonistic (upper), the synergistic (lower), and the additivity (on the line) regions are shown. The analysis indicates synergism at the IC50 level. Data points in circles represent the mean of 3 independent replicates.

