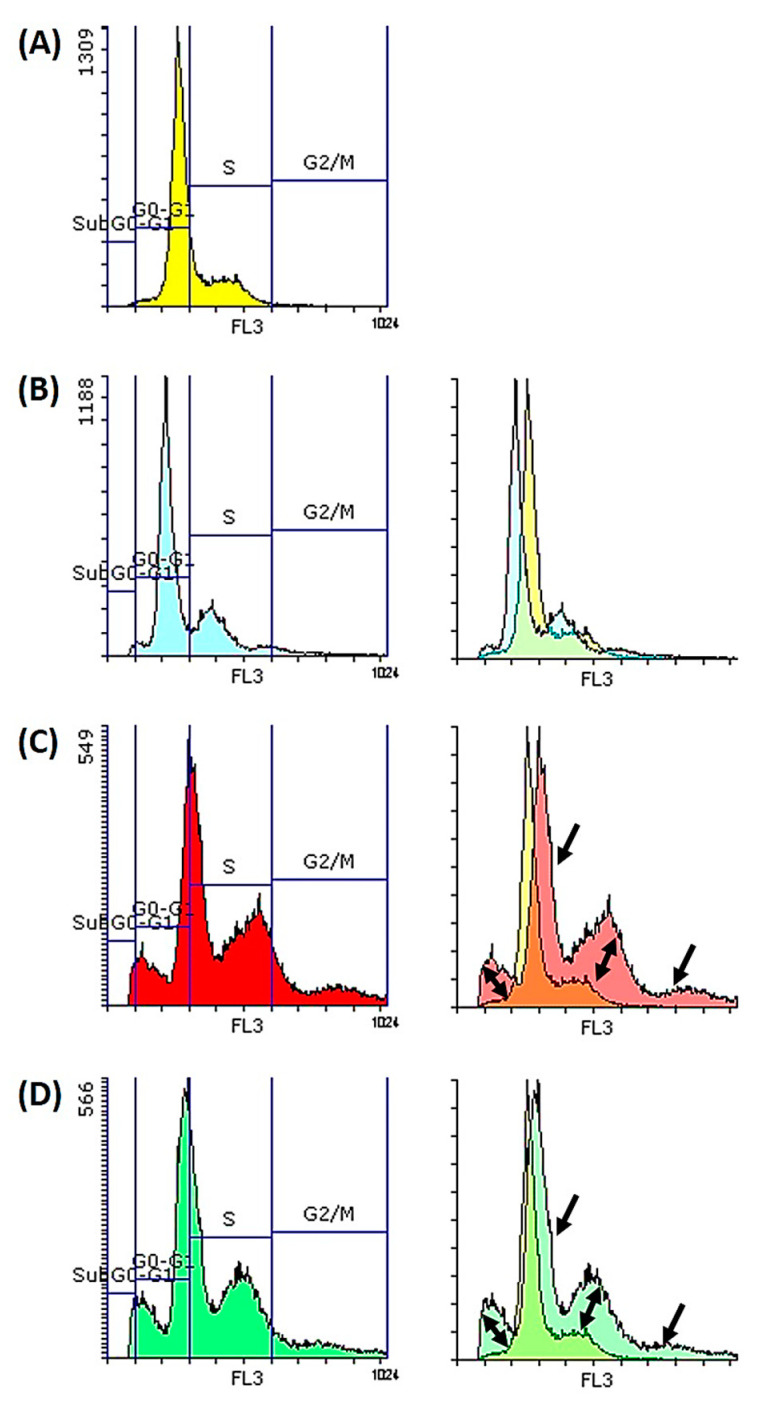
Figure 3.
Cell cycle analysis (DNA analysis) of Caco-2 cells treated for 24 h with IC50 of retinoids. The histograms of (A) negative control exposed to 0.1% DMSO solvent (yellow histogram), (B) ATRA (blue histogram), (C) EC19 (red histogram), and (D) EC23 (green histogram) are shown, together with the overlay histograms of each synthetic retinoid compared to the solvent control. Regions of cell cycle arrest are indicated with black arrows reflecting the early apoptosis compared to control.

