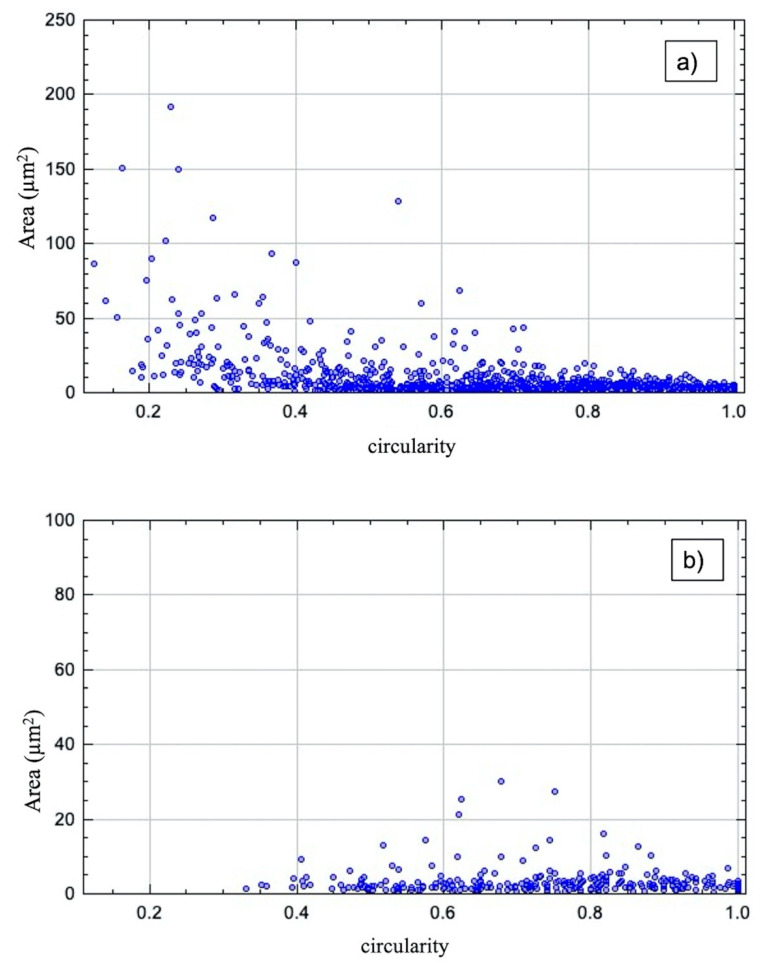
Figure 7.
Comparison of (a) US and (b) TRM dispersion of 0.5 wt% CNToxi of the circularity in reliance to the area in µm2. Area errors can be estimated through the grey value evaluation of the microscopic images in imageJ with about 1% of the values given. The two plots feature different scaling of the y-axis.

