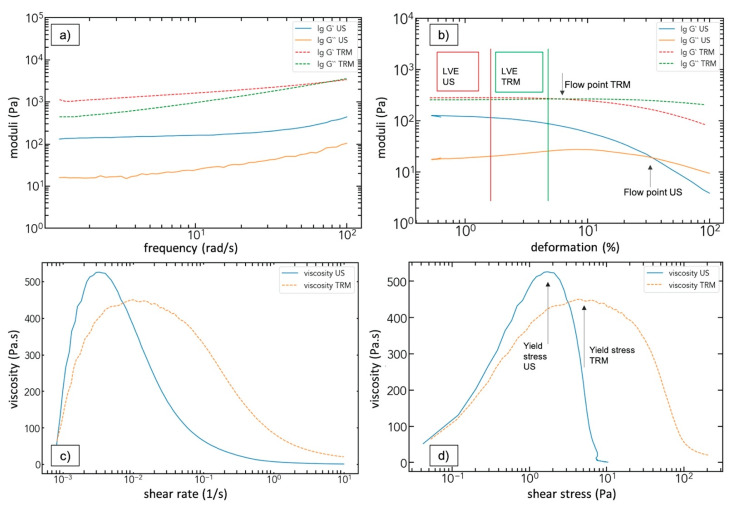
Figure 8.
Overview of the different applied rheological tests and the resulting plots shown for the CNT 0.5 wt% US sample: (a) frequency sweep and the comparison of US and TRM dispersion; (b) amplitude sweep indicating the linear viscoelastic regime (LVE) and the flow point; (c) viscosity measurement showing the shear thinning behavior; (d) shear stress and the corresponding yield stress.

