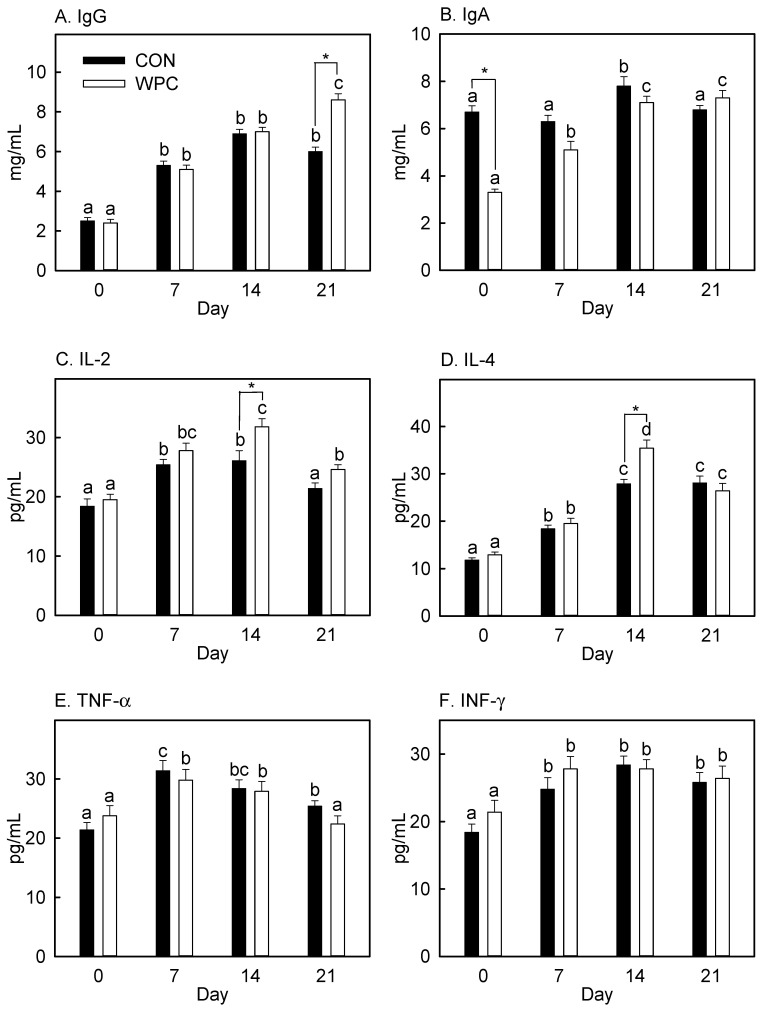
Figure 2.
Changes in plasma immunoglobulins and cytokines concentrations in rats after antigen injection. Values are expressed as mean ± S.E. (n = 5). IgG, immunoglobulin G; IgA, immunoglobulin A; IL-2, interleukin-2; IL-4, interleukin-4; TNF-α, tumor necrosis factor-α; INF-γ, interferon-γ. * Significantly different when compared with CON on an identical Day by Student t-test (p < 0.05). a,b,c,d Significantly different compared with Day 0 of each dietary treatment by ANOVA and Fisher’s least significant difference test (p < 0.05).

