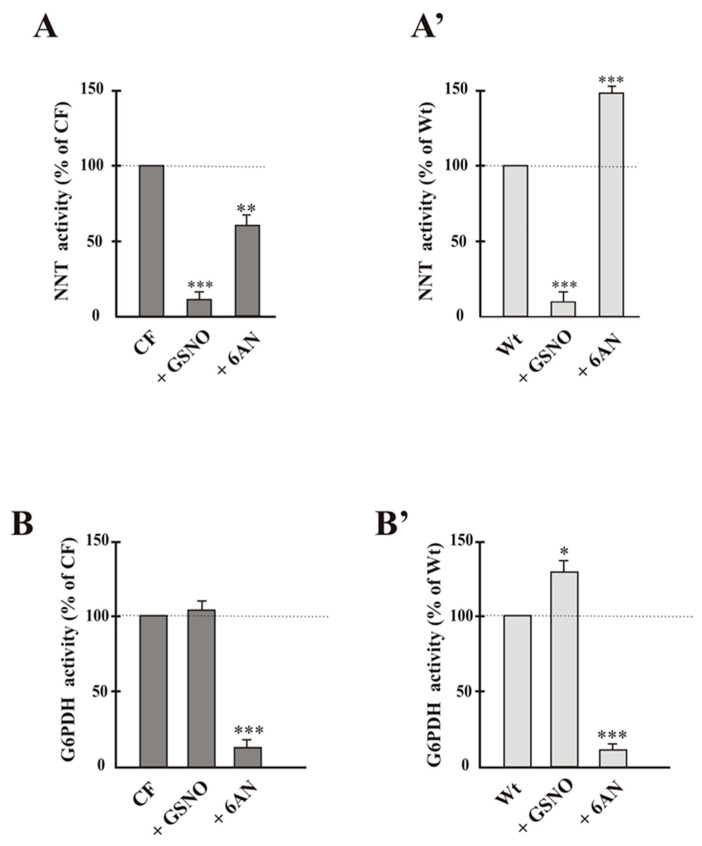
Figure 3.
NNT (A-A’) and G6PDH (B-B’) activities in the presence of own and the specific inhibitor of the other enzyme. Values were subjected to statistical analysis (Wt, n = 5; CF, n = 4). Each value was expressed as % of control, i.e., sample in the absence of compound, to which value 100 was given. * p < 0.05; ** p < 0.01; *** p < 0.001 when comparing untreated cells with the cells in the presence of compounds, i.e., 6AN (5 mmol/L), GSNO (1 mmol/L).

