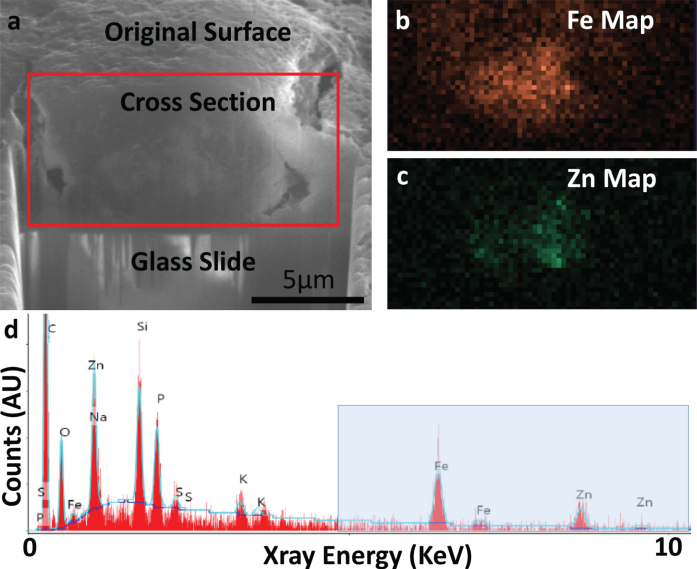
Fig. 3.
FIB-SEM cross-sectioning (a) and SEM-EDS (b-d) of specimen A5 confirming presence of iron (Fe) and zinc (Zn). a) SE-SEM image of the exposed cross section, with the glass slide/substrate visible below. The scale bar is the same for a-c, but is only accurate in the indicated direction as the sample is viewed at an angle. This cross section was acquired at the position of the red line in Fig. 2a. b) EDS iron map at 6.4 keV acquired on the boxed region from (a), confirming the presence of an iron-rich feature. c) EDS zinc map at 8.6 keV acquired on the boxed region from (a), confirming the partially-overlapping presence of a zinc-rich feature. d) Overview EDS spectrum integrated across the tissue cross section, showing iron as well as zinc. Peaks for common organic elements (carbon (C), phosphorus (P), sodium (Na), sulfur (S)) are present, as well as silicon (Si) and oxygen (O) from the glass. The blue box indicates the energy space relevant for identifying iron and zinc in our specimens. This spectral range is shown for the remaining specimens in Fig. 4. The blue line depicts a background fit.

