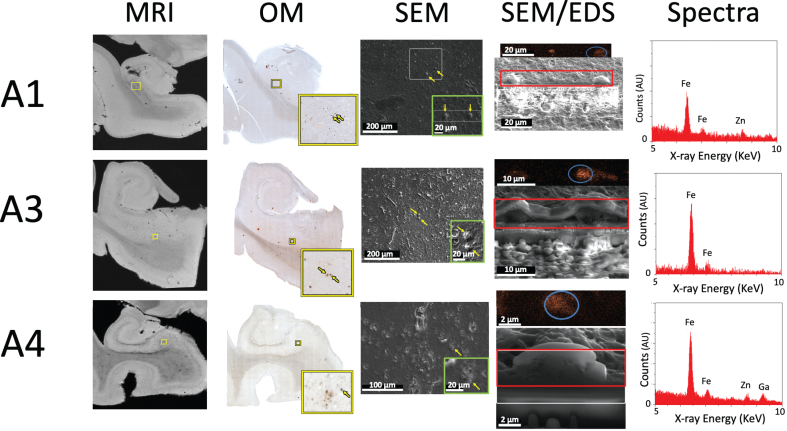
Fig. 4.
MRI, optical microscopy, SEM, cross-sectional SEM and EDS of specimens A1, A3, and A4 demonstrating the presence of iron in each. MRI: High-resolution MRI demonstrates clear hypointensities concentrated in the subiculum. OM: Optical microscopy of each specimen, with the yellow box visualizing a higher-resolution inset of iron-positive foci highlighted by the yellow arrow(s). SEM: Top-down SEM of the region in yellow box from OM, demonstrating matching regions across modality. The green box shows a higher resolution inset of visible raised features, rotated to match the plane of SEM/EDS. For A3, the SEM is rotated 90 degrees compared to OM. SEM/EDS: Cross-sectional FIB-SEM and SEM-EDS iron map proving the presence of iron in each raised feature. Spectra: Overview EDS spectrum from region outlined by blue circle in SEM/EDS, showing the presence of iron (Fe) in all specimens, as well as zinc (Zn) in A1 and A4.

