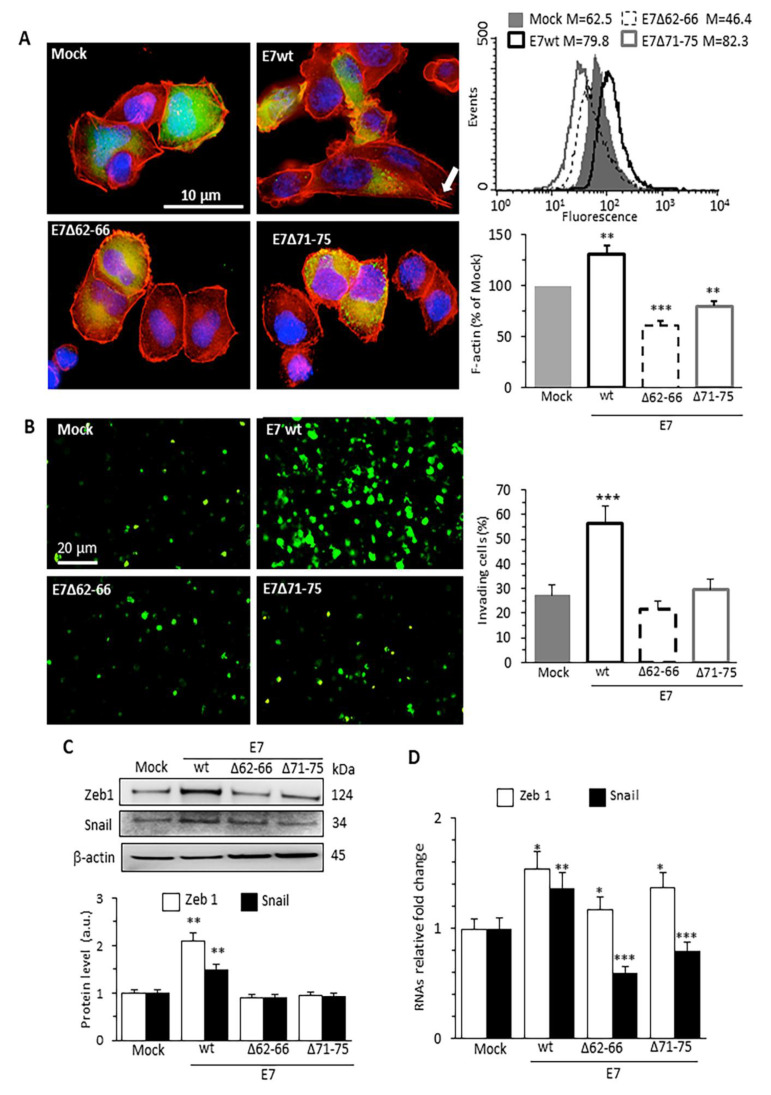
Figure 1.
HPV16E7 expression promotes actin cytoskeleton remodeling, cell invasion ability and EMT in human cervical cancer cells. (A) IVM analysis after double-cell staining with TRITC-phalloidin (red) and Hoechst (blue) in C33A cells transfected (green) with pAmCyan empty vector (Mock), pAmCyan-HPV16E7 wild-type (E7wt) or deletion (E7mut) mutant constructs pAmCyan-HPV16E7Δ62–66 (E7Δ62–66) or pAmCyan-HPV17E7Δ71–75 (E7Δ71–75). E7wt-expressing cells show different morphological features compared to both Mock- and E7 mutant transfected cells. Arrow indicates protrusive and invasive structures (left). Flow cytometry evaluation of the intracellular amount of F-actin restricted to pAmCyan-positive cells. Histograms obtained in a representative experiment are shown. Bar graph shows the mean ± SD of the median fluorescence intensity obtained in four different experiments. ** p < 0.01 and *** p < 0.001 vs. Mock transfected cells (right). (B) Representative images of transwell invasion assay of pAmCyan C33A transfected cells (left). Fluorescence emission of C33A migrating through Matrigel are quantified by IVM analysis and expressed as percentage (right). (C) Western blot analysis of the expression of the EMT markers Zeb1 and Snail. β−actin determination was used as loading controls. Bar graph (bottom) shows relative densitometry quantitation of each protein normalized to β-actin obtained in three independent experiments and reported as mean ±SD. ** p < 0.01 vs. Mock transfected cells. Uncropped western blot figure available in Supplementary Figure S5. (D) Bar graph showing the evaluation of mRNA levels of Zeb1 and Snail performed by qRT-PCR assay. Data are reported as mean ±SD of RNAs relative fold change vs Mock-transfected cells obtained in three independent experiments. * p < 0.05, ** p < 0.01 and *** p < 0.001 vs. Mock transfected cells.

