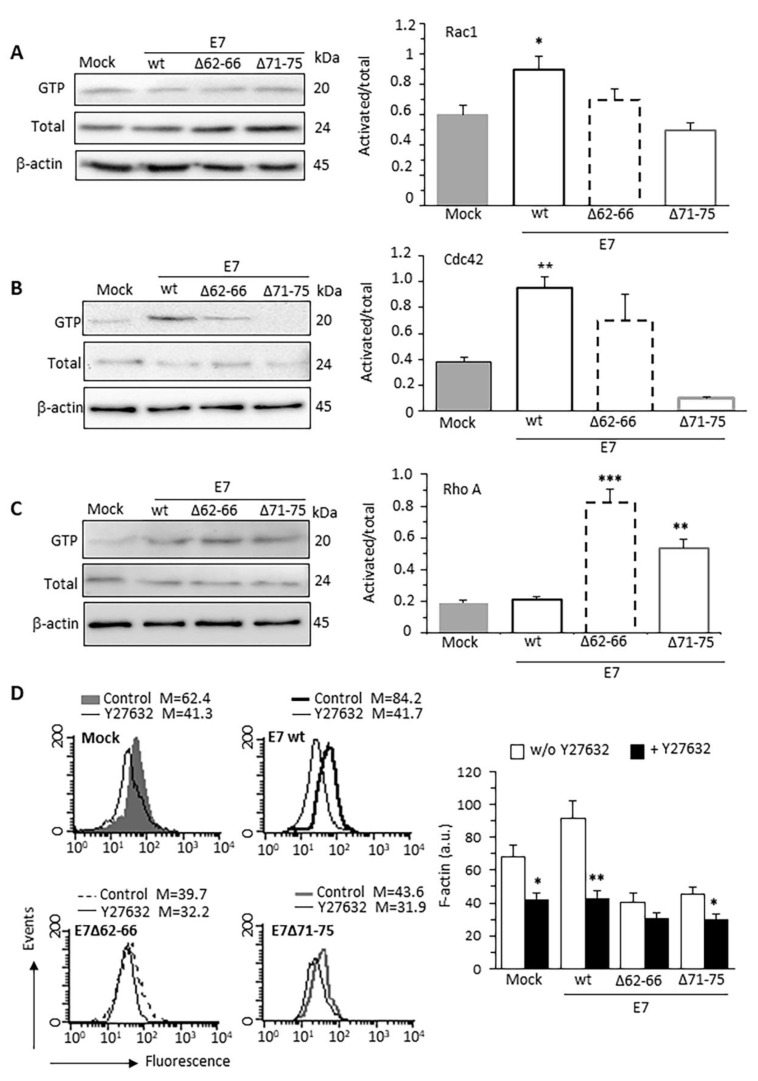
Figure 2.
HPV16E7 expression induces activation of Rac1 and Cdc42 GTPases. Activation state of RhoGTPases measured by pull-down assays using PBD domain of PAK for Rac1 (A) or Cdc42 (B), and the RBD domain of Rhotekin for RhoA (C), followed by immunoblotting with the respective antibodies. In addition, Rac1, Cdc42, or RhoA from total lysates were quantified (left panels). In the right panels, bar graph shows the active forms of Rac1, Cdc42, and RhoA GTP (GTP-bound levels/total levels) normalized to β-actin. The mean ± SD of the results obtained in three independent experiments is shown. * p < 0.05, ** p < 0.1 and *** p < 0.001 vs. Mock transfected cells. (D) Flow cytometry evaluation of the intracellular amount of F-actin, restricted to pAmCyan-positive cells, before or after treatment with the RhoGTPase inhibitor Y27632 (15 µM for 40 min). Bar graph (right) reports results as mean ± SD of the median fluorescence intensity obtained in three different experiments. * p < 0.05 and ** p < 0.01, vs the same sample treated with Y27632. Uncropped western blot images for Figure 2A–C available in Supplementary Figure S6.

