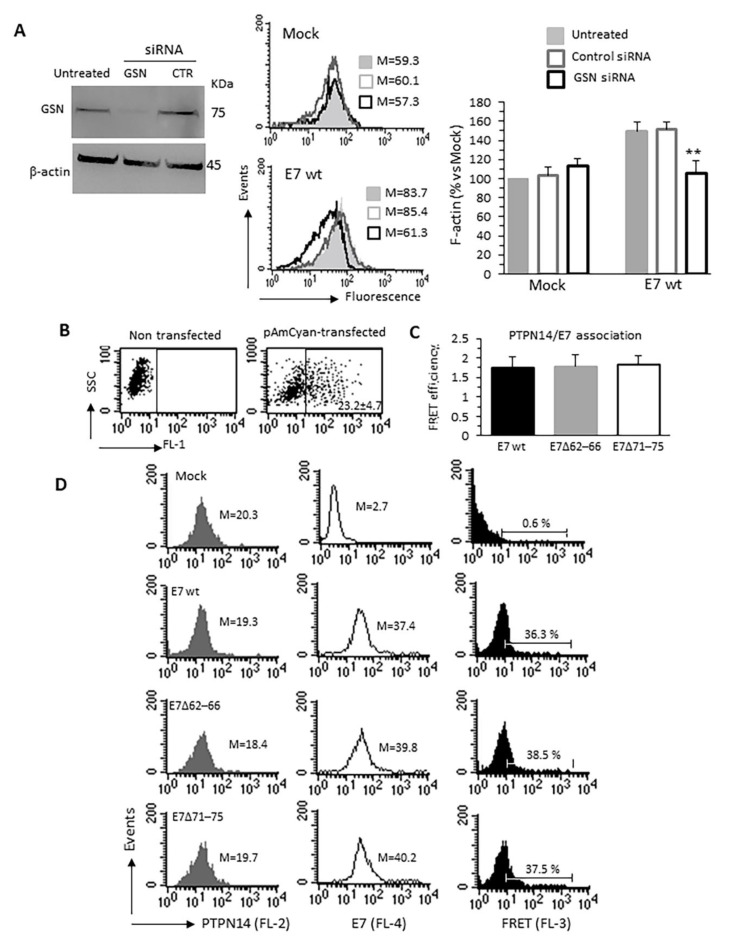
Figure 4.
Specific relevance of E7-GSN interaction. (A) Representative western blot of endogenous gelsolin (GSN) knockdown showing the relative abundance of GSN in pAmCyan trasfected cells (Mock), in transfected cells treated with specific siRNAs for GSN silencing (siRNAGSN) or treated with scrambled siRNAs as a negative control (siRNAcontrol) (left). Flow cytometry evaluation of the intracellular amount of F-actin restricted to pAmCyan-positive cells transfected with siRNAGSN or scrambled siRNA as control. Histograms obtained in a representative experiment are shown. Bar graph (right) shows the mean ± SD of the median fluorescence intensity obtained in four different experiments. ** p < 0.01 and *** p < 0.001 vs. Mock transfected cells. (B–D) Quantitative evaluation of PTPN14/E7 molecular association by FRET technique. (B) Flow cytometry analysis was restricted to pAmCyan-positive cells (reported as percentage). Bar graph in (C) shows FRET efficiency calculated according to the Riemann’s algorithm. Data are reported as mean ± SD from three independent acquisitions. (D) Cytofluorimetric histograms obtained in one experiment representative of three. Numbers in the first and second columns indicate the median fluorescence intensity of the respective proteins, the percentage in the third column represent FL3 positive events. Uncropped western blot images for Figure 4A are available in Supplementary Figure S8.

