Figure 5.
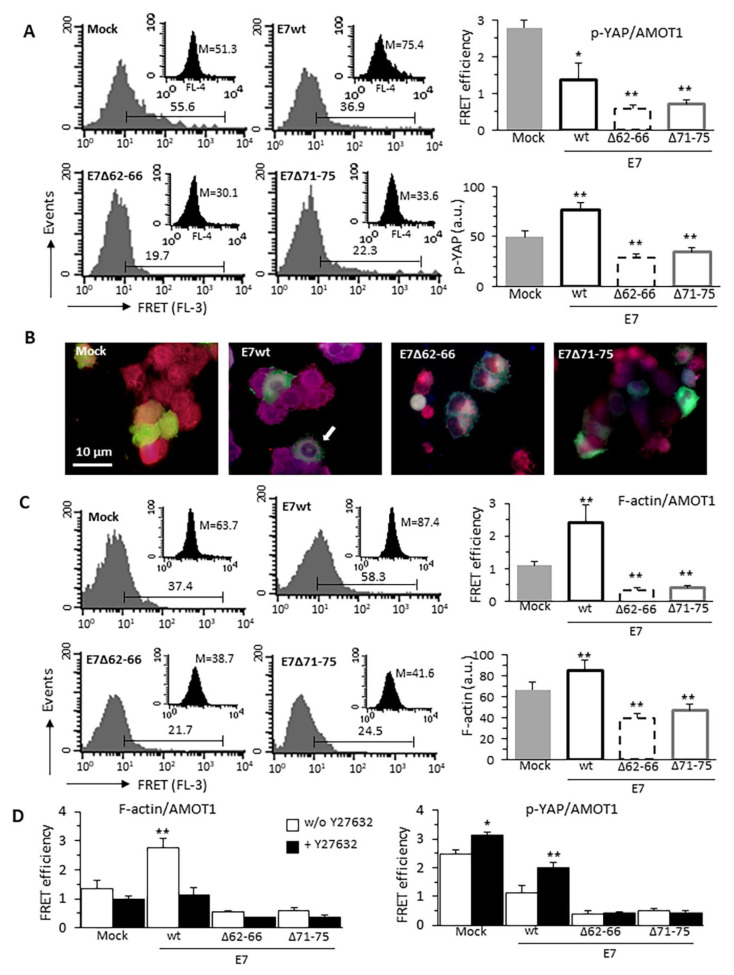
E7-induced F-actin alterations interfere with p-YAP/AMOT1 interactions. Quantitative evaluation of (A) p-YAP/AMOT1 and (C) F-actin/AMOT1 molecular association by FRET technique, as revealed by flow cytometry analysis restricted to pAmCyan-positive cells. Numbers indicate the percentage of FL3-positive events, obtained in one experiment representative of three. Bar graphs on right show FRET efficiency calculated according to the Riemann’s algorithm. Data are reported as mean ± SD from three independent experiments. Inset: representative flow cytometry histograms of p-YAP expression (A) or F-actin amount (C) in the corresponding sample. Numbers indicate the median fluorescence intensity. Bar graphs on the bottom right represent the mean ± SD of the median fluorescence intensity values obtained in three different experiments. * p < 0.05 and ** p < 0.01 vs. Mock transfected cells. (B) IVM analysis after double cell staining with anti-p-YAP (blue) and anti-AMOT antibody (red) of cells transfected (green) with pAmCyan empty vector (Mock), E7 wild-type (E7wt) or deletion mutant constructs E7Δ62–66, E7Δ71–75. To note that p-YAP/AMOT complexes appeared markedly distributed in the perinuclear area of E7wt cells while were reduced and scattered in the cytoplasm of mutant cells (see arrow); (D) Bar graphs showing F-actin/AMOT1 (left) and p-YAP/AMOT1 (right) molecular association observed in different samples treated or not with the RhoGTPase inhibitor Y27632 and quantified as FRET efficiency. Analysis was restricted to pAmCyan-positive cells. Data are reported as mean ± SD from three independent experiments.

