Fig. 4.
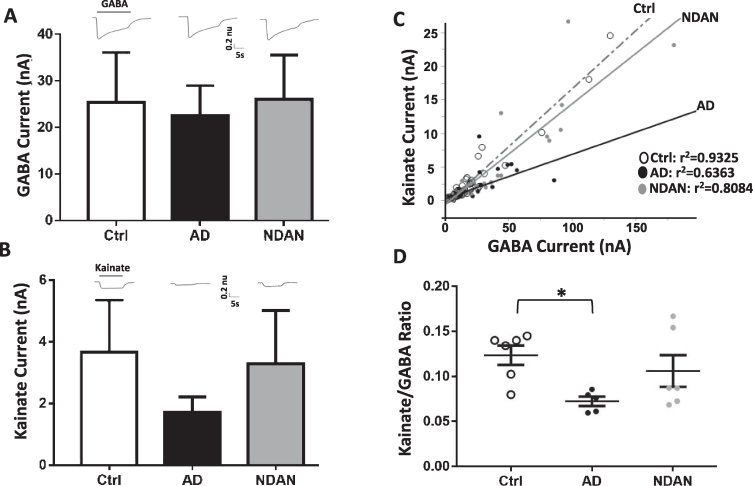
Differential activation of microtransplanted synaptic AMPA and GABA receptors from the frontal cortex of Ctrl, AD and NDAN subjects. A) GABA currents (elicited using 1 mM GABA), representing the inhibitory component, show no significant differences between Ctrl (clear bars), AD (black bar), or NDAN (grey bar). B) Similar to GABA, Kainate currents (elicited using 100 mM Kainate), representing the excitatory component, show no significant difference between the three groups. Representative ion currents for each group is provided above the bars and represented in normalized units (n.u.) to facilitate comparison of the amplitudes of GABA and kainate currents in the same scale. Kainate, instead of glutamate, was used to avoid AMPA receptors desensitization. C) Linear correlation between maximal kainate and GABA responses measured in single oocytes across groups. Each dot in this figure represents a single recorded oocyte. (r2 are shown next to each group; *p < 0.0001). D) Average of the Kainate/GABA ratio in each subject shows reduced values in AD compared to control but not to NDAN. The current ratio was different across groups (with significant reduction between Ctrl and AD (*p = 0.0388), but not between Ctrl and NDAN (p > 0.99) or AD and NDAN (p = 0.2268). Each dot represents a single subject. Color schematic for each group are provided in the legends for (C) and (D).

