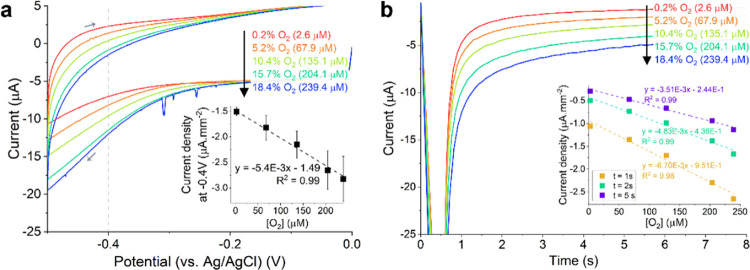
Figure 4.
(a) CV (SR = 100 mV/s) recorded on RuOx electrode in PBS with different aeration. The gray arrows denote the scan direction. The inset plots the reductive current measured at −0.400 V normalized to the electrode’s geometric surface area against O2 concentration, which shows a highly linear correlation. The error bars show one standard deviation among four different electrodes. (b) Recorded current from chronoamperometry measurements recorded on RuOx electrode at −0.400 V in PBS with different aeration. The inset plots current at a different point in time normalized to the electrode’s geometric surface area against O2 concentration.

