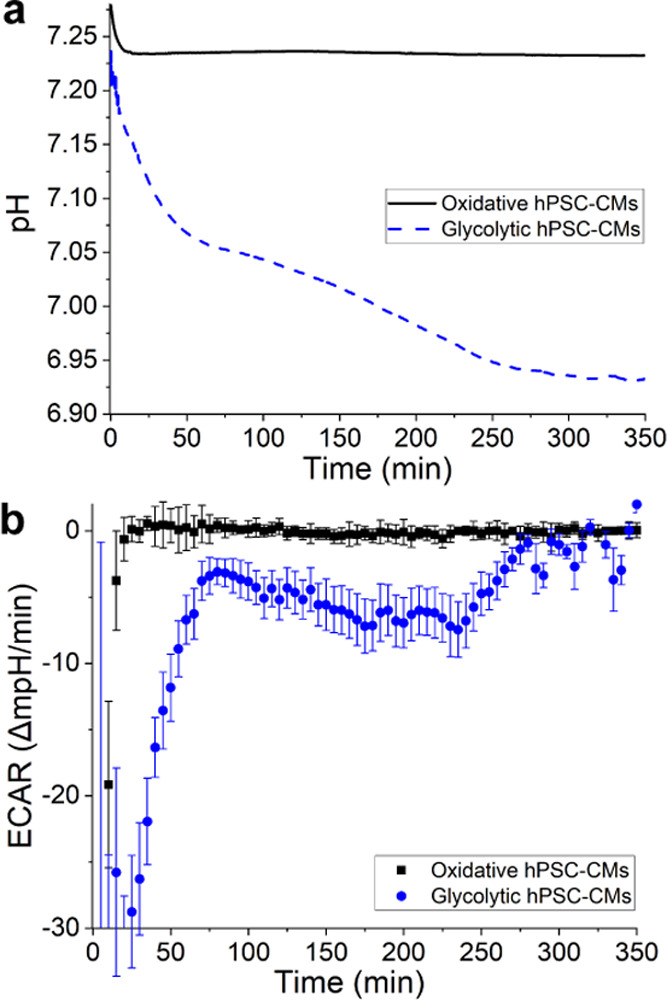
Figure 6.

(a) pH change throughout day 2 in the presence of hPSC-CMs (535 000 cells/cm2) in low-buffering CM-TDI medium. (b) Calculated ECARs of the hPSC-CMs. The ECARs were calculated in 5 min interval; the error bars plot one standard deviation of the 5 min measurement.
