Fig. 7.
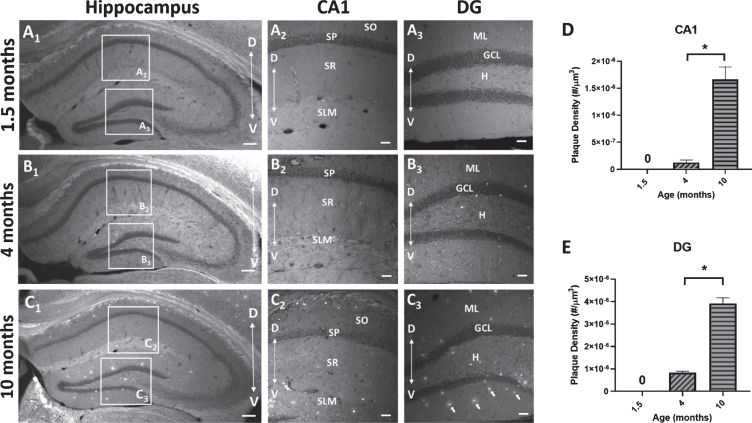
Amyloid-β (Aβ) plaque deposits in the hippocampus of 5×FAD mice. Coronal sections (40μm) of the dorsal hippocampus (AP, -2.0 bregma) from 1.5, 4, and 10-month-old 5×FAD mice were stained with the amyloid imaging agent BTA-1. A1-C1) Representative images of the hippocampus of 5×FAD mice demonstrating the observed age-dependent increase in Aβ plaque accumulation and the regions of interest (ROI) in CA1 and dentate gyrus (DG) that were used to quantify Aβ plaque density. A2,3-C2,3) Representative maximum intensity projection images (20× air; 635μm×635μm×15μm, Δz = 5μm) of Aβ plaque deposits in CA1 and DG from 1.5, 4, and 10-month-old 5×FAD mice. Arrows in panel C3 point to BTA-1 stained Aβ plaques. D, E) Aβ plaque density (plaque #/μm3) was quantified in the CA1 region and DG from 20× images using the Analyze Particles plug-in in FIJI. Significant differences in Aβ plaque density were found between 4-month-old and 10-month-old 5×FAD mice. Analysis of the 1.5-month-old mice were not included because no plaques were observed. Hippocampal layers; CA1: stratum oriens (SO), stratum pyramidale (SP), stratum radiatum (SR), stratum lacunosum-moleculare (SLM) and DG: molecular layer (ML), granule cell layer (GCL) and the hilus (H). Scale bar: 4× images = 200μm, 20× images = 50μm. Asterisks (*) represent significance determined by a 2-tailed unpaired t-test with p < 0.05. Dorsal (D) ← →Ventral (V).

