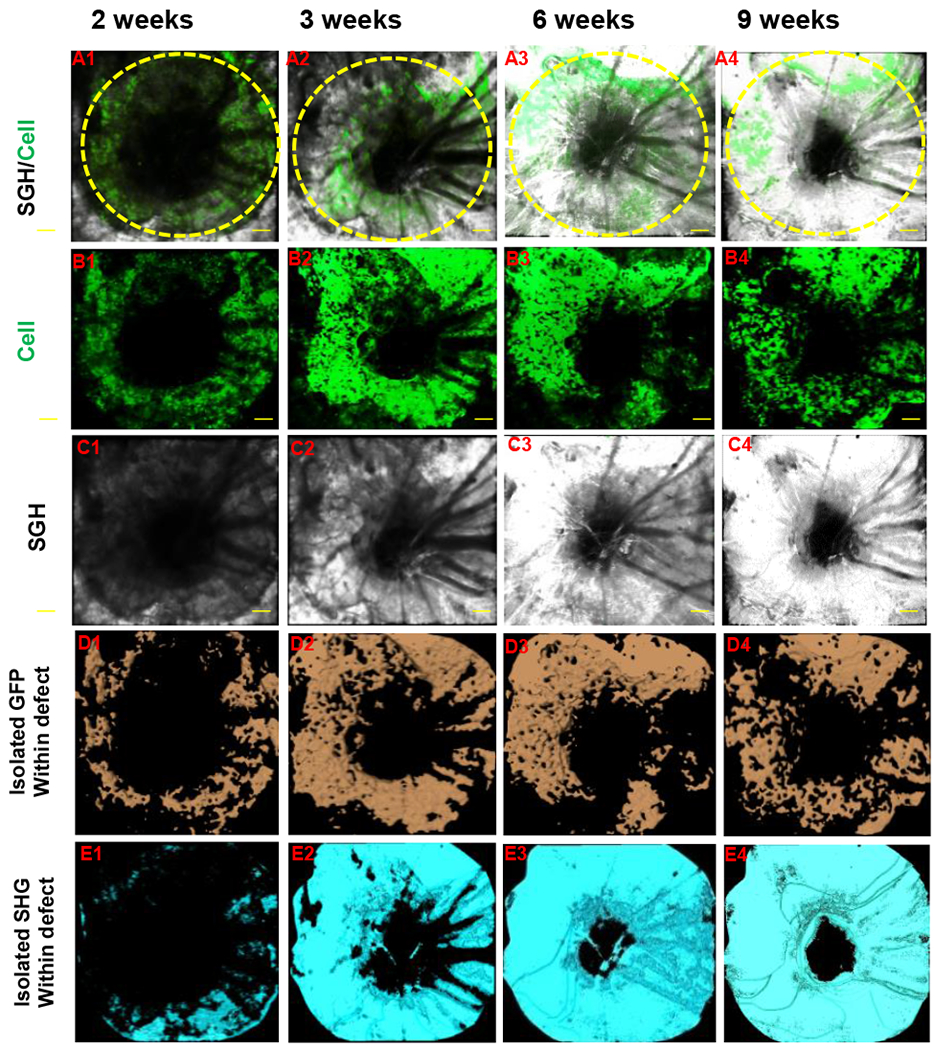
Figure 2. Quantitative and volumetric analyses of GFP and SHG signals in cranial defect healing.

A bony defect was created in Col2.3GFP transgenic mouse as previously described. The defect healing was imaged over a period of 9 weeks using MPLSM. Propagation of SHG and differentiation of Col2.3GFP (+) osteoblasts were illustrated in panel A (SHG and GFP + cells), B (GFP + cells) and C (SHG, white). Signals of GFP and SHG were isolated within the defect region by proper thresholding across all samples. Volume of GFP (+) cells (D, orange) and SHG (E, cyan) were further calculated based on isolated signals.
