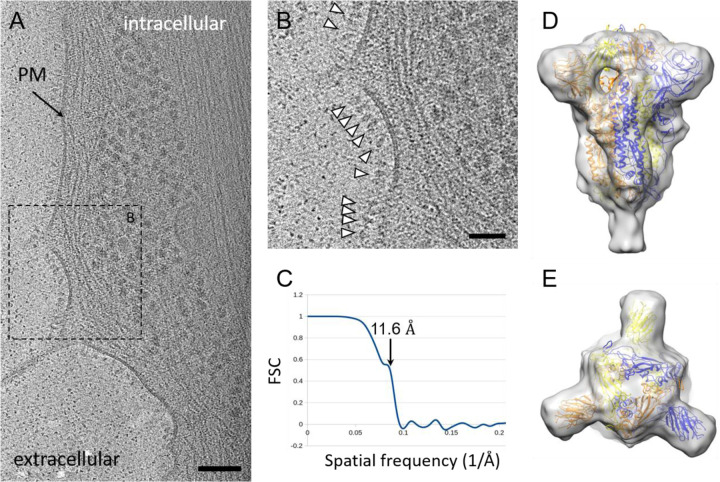
Figure 2. Cryo-ET and subtomogram average of ChAdOx1 nCoV-19 derived spike.
(A) Tomographic slice of U2OS cell transduced with ChAdOx1 nCoV-19. The slice is 6.4 Å thick; PM = plasma membrane, scale bar = 100 nm (B) Detailed view of the boxed area marked in (A). White arrowheads indicate spike proteins on the cell surface; scale bar = 50 nm. (C-E) Subtomogram average of ChAdOx1 nCoV-19 spikes at 11.6 Å resolution as indicated by Fourier-Shell correlation at 0.5 cut-off (C), shown from side view (D), and top view (E). SARS-CoV-2 atomic model (PDB 6ZB5) (29) is fitted for reference.

