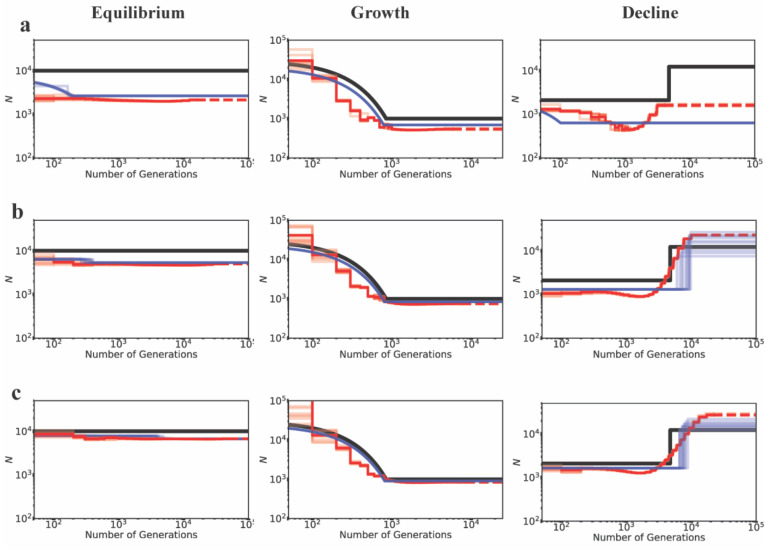
Figure 3:
Inference of demography by MSMC (red lines; 10 replicates) and fastsimcoal2 (blue lines; 10 replicates) in the presence of BGS with varying proportions of the genome under selection, for demographic equilibrium (left column), exponential growth (middle column), and instantaneous decline (right column). Exonic sites were simulated with purifying selection with all fi values equal to 0.25 (DFE4; see Table 1), and were masked when performing inference. Directly selected sites comprise (a) 20% of the simulated genome, (b) 10% of the simulated genome, and (c) 5% of the simulated genome. The true demographic models are given by the black lines, with the x-axis origin representing the present day. The dashed lines represent indefinite extensions of the ancestral population sizes. Detailed methods including command lines can be found at: https://github.com/paruljohri/demographic_inference_with_selection/blob/main/CommandLines/Figure3.txt

