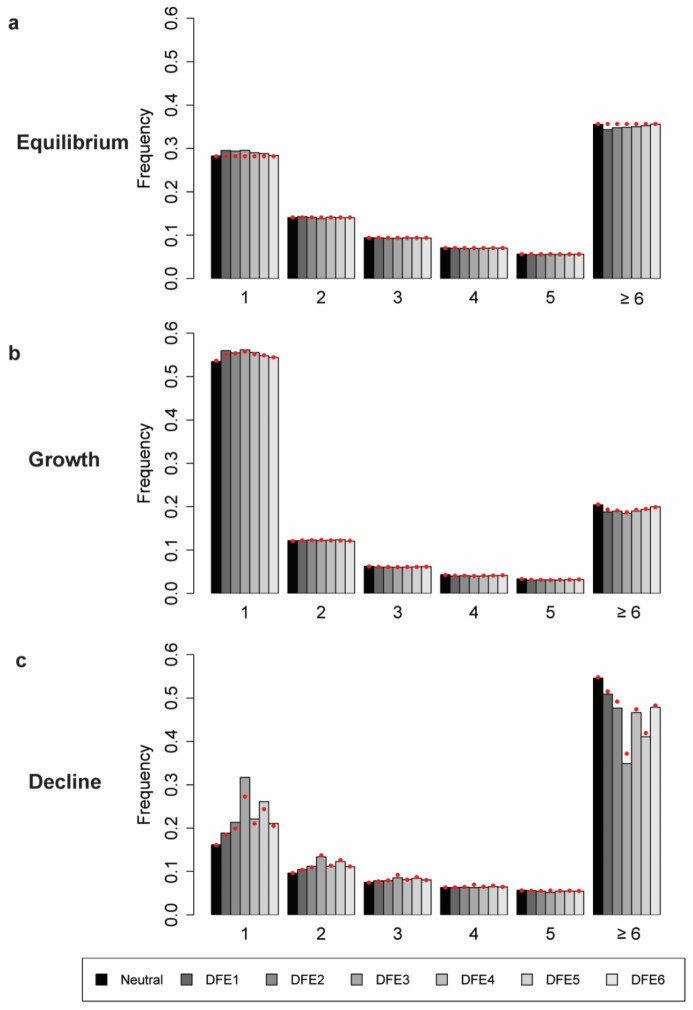
Figure 5:
The site frequency spectrum (SFS) of derived allele frequencies at neutral sites from 10 diploid genomes under (a) demographic equilibrium, (b) population growth, and (c) population decline, under the same DFEs as shown in Figure 4. The x-axis indicates the number of sample alleles (out of 20) carrying the derived variant. Exonic sites comprised ~10% of the genome, roughly mimicking the density of the human genome. The red solid circles give the values predicted analytically with a purely neutral model, but correcting for BGS by using the B values of the ancestral population (i.e., pre-change in population size) obtained from simulations, in order to quantify the effective population size. Detailed methods including command lines can be found at: https://github.com/paruljohri/demographic_inference_with_selection/blob/main/CommandLines/Figure5.txt

